Attribute table — Configure the attribute table and the vector selection
Principle
Lizmap is designed to show spatial data in the main map, and you can propose users to see an object data through the “popup” feature (a small popup containing the objects data is shown whenever the user clicks on the map ). See Popup
Sometimes this is not enough, and as a map editor, you would like the user to see all the data of a specific layer, as you can do in QGIS by opening the attribute table.
Note
When activating the attribute table on a layer, it also activates :
graphical selection tools
export of features as a file
Prerequisites
The layer must be published as WFS (see WFS/OAPI) and the primary key must be published as well in the Layer properties.
Configuring the tool
At the layer level
In the Tools tab of Lizmap plugin dialog, there is a group called “Attribute layers” which shows a table and some form fields dedicated to add or remove vector layers.
To add a layer to this tool:
Click the
button.
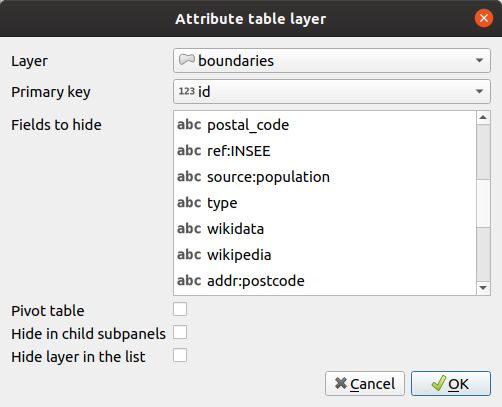
Layer: Choose one of the vector layers (spatial or not). This can be any vector layer format : GeoJSON, Shapefile, PostGIS, CSV, etc.
Unique ID: The attribute table tool needs to be able to defined each feature as unique. We strongly advise you to add such a field if your layer has not one yet. Usually the unique ID field contains integers. If the layer do not have this kind of field, you can easily create it with the Field calculator. Choose the correct field with the combo box.
Fields to hide: You have 2 ways of hiding fields in the published attribute table.
In the vector layer properties dialog of the QGIS vector layer, in the Fields tab, you can uncheck the checkbox of the column WFS for the fields to unpublish. This means this fields will not be published via the WFS protocol. This is the simplest and safest way to restrict the publication to some fields (for example to get rid of sensitive fields)
You can use this Fields to hide option to hide the given fields in the attribute table display. The hidden fields won’t be visible for the end user, but will still be available for Lizmap Web Client. You must use this option to hide the Unique ID field. If you use the first way (uncheck WFS column), the unique ID won’t be usable by Lizmap, and some of the attribute table features will not work properly.
Let the Pivot table unchecked. This is for relation.
Let the Hide in child sub-panels unchecked. This is for relation.
Let the Hide layer in the list unchecked. This is for relation.
To edit a layer in the table, select it and click the
 button or double click on the row.
To remove a layer from the table, select it and click the
 button.
To move a layer up or down, select it and click
 or
or  buttons. The order will change in Lizmap too.
Fields will be displayed with their alias if it’s defined. See Add a alias on a field.
At the project level
Order of fields
Lizmap is reusing the order of the fields defined in the attribute table.
Open your attribute table.
Right click on a column header.
Click organize Columns…
Drag and drop columns.
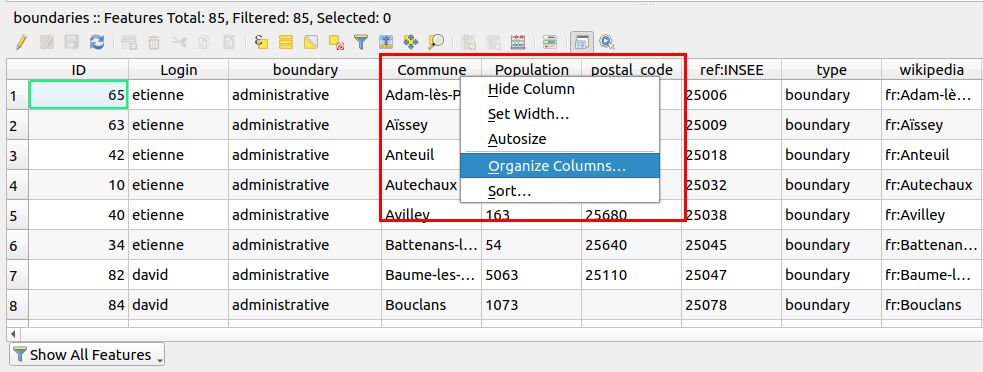
When defining a custom order, it should automatically alter the checkbox called Custom configuration.
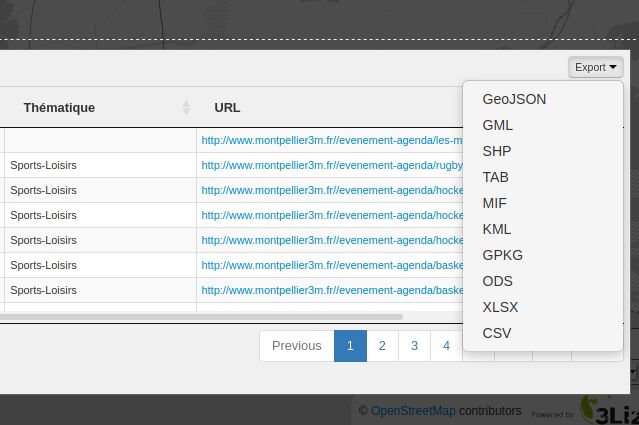
Download data
By adding the layer in the attribute table tool, this will also enable the download capability on that layer. By default, only GeoJSON and GML are available. By installing the WfsOutputExtension plugin on QGIS Server, you can add more formats such as Geopackage, ODS, CSV, XLSX …. Read https://github.com/3liz/qgis-wfsOutputExtension
Using with relations
In QGIS, you can configure relations between layers, in the project properties dialog. If you publish in Lizmap more than one layers in the attribute layers tool, and if some layers are part of a relation, the end user will be able to see child tables under the parent layer table, and a click on one line in the parent table will trigger the filter of the child tables content.
For example, you could have a layer of cities, and a child layer of public building. Clicking on one city in the attribute table will make the public building child table refresh its content with only the public buildings of the clicked city.
You can use “many-to-many” (N:M) relations in QGIS since version 2.14 but Lizmap doesn’t use it automatically yet. You have to define the relations in the Lizmap plugin too. In many cases, N:M relations are very handy. For example, you can have the three following vector layers in your project:
Tramway lines: this layers name “Lines” contains one feature per tram line, and has a unique ID field tram_id
Tramway stops: this layer named “Stops” contains one feature per tram stop, with a unique ID field called stop_id
Correspondance table between lines and stops: this layer named “Pivot” is a pivot table between tram lines and stops, since a stop can be used for more than one line, and a line serves many stops. It has the following fields: tram_id, stop_id and order which defines the order of the stop in the line.
You can add 2 relations in QGIS project properties : one between Lines and Pivot using the tram_id field, and one between Stops and Pivot using the stop_id field.
In Lizmap, we added a simple way to configure the N:M relation. You can simply
Create the two relations described above in QGIS project properties dialog, tab Relations
Add the Lines and Stops layers in the attribute layers tool
Add the Pivot layer in the attribute layers tool with the option Pivot table checked
Lizmap Web Client will then handle the relation as a N:M relation:
The pivot table will be displayed under each parent attribute table and show only the corresponding children.
The filter feature based on the attribute layers will trigger the cascading filter of the pivot and the other parent. For example, if the user uses the filter to show only one tramway line, Lizmap will also only show the corresponding stops in the map and in the Stops attribute tables
Tips
If one of the field contains a media path, such as media/a_folder/my_image.jpg,
Lizmap will display a link allowing the user to open the media file (image, video, PDF, etc.)
in a new browser tab.
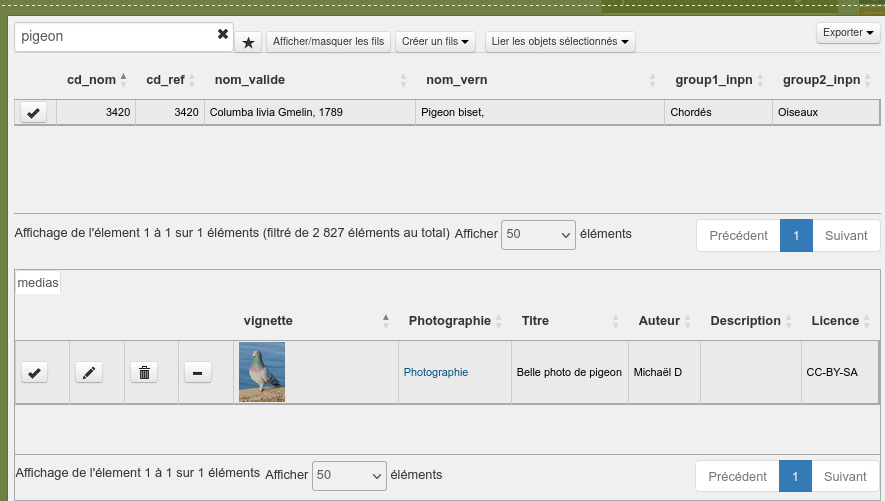
If the media points to an image (a JPG or PNG file), you could add new column showing
a small image preview of the source image by adding a new virtual field in your vector layer,
with this expression (which create an image with a data attribute containing the image path and a CSS class data-attr-thumbnail). In the example below, the field containing the media path is media_path
and the virtual field is named vignette:
concat(
   '<img class="data-attr-thumbnail" data-src="',
   "media_path" ,
   '" src="/themes/default/css/img/logo_footer.png" style="height:60px;">'
)
The result will look like: