Dataviz - Afficher quelques graphiques
Principe
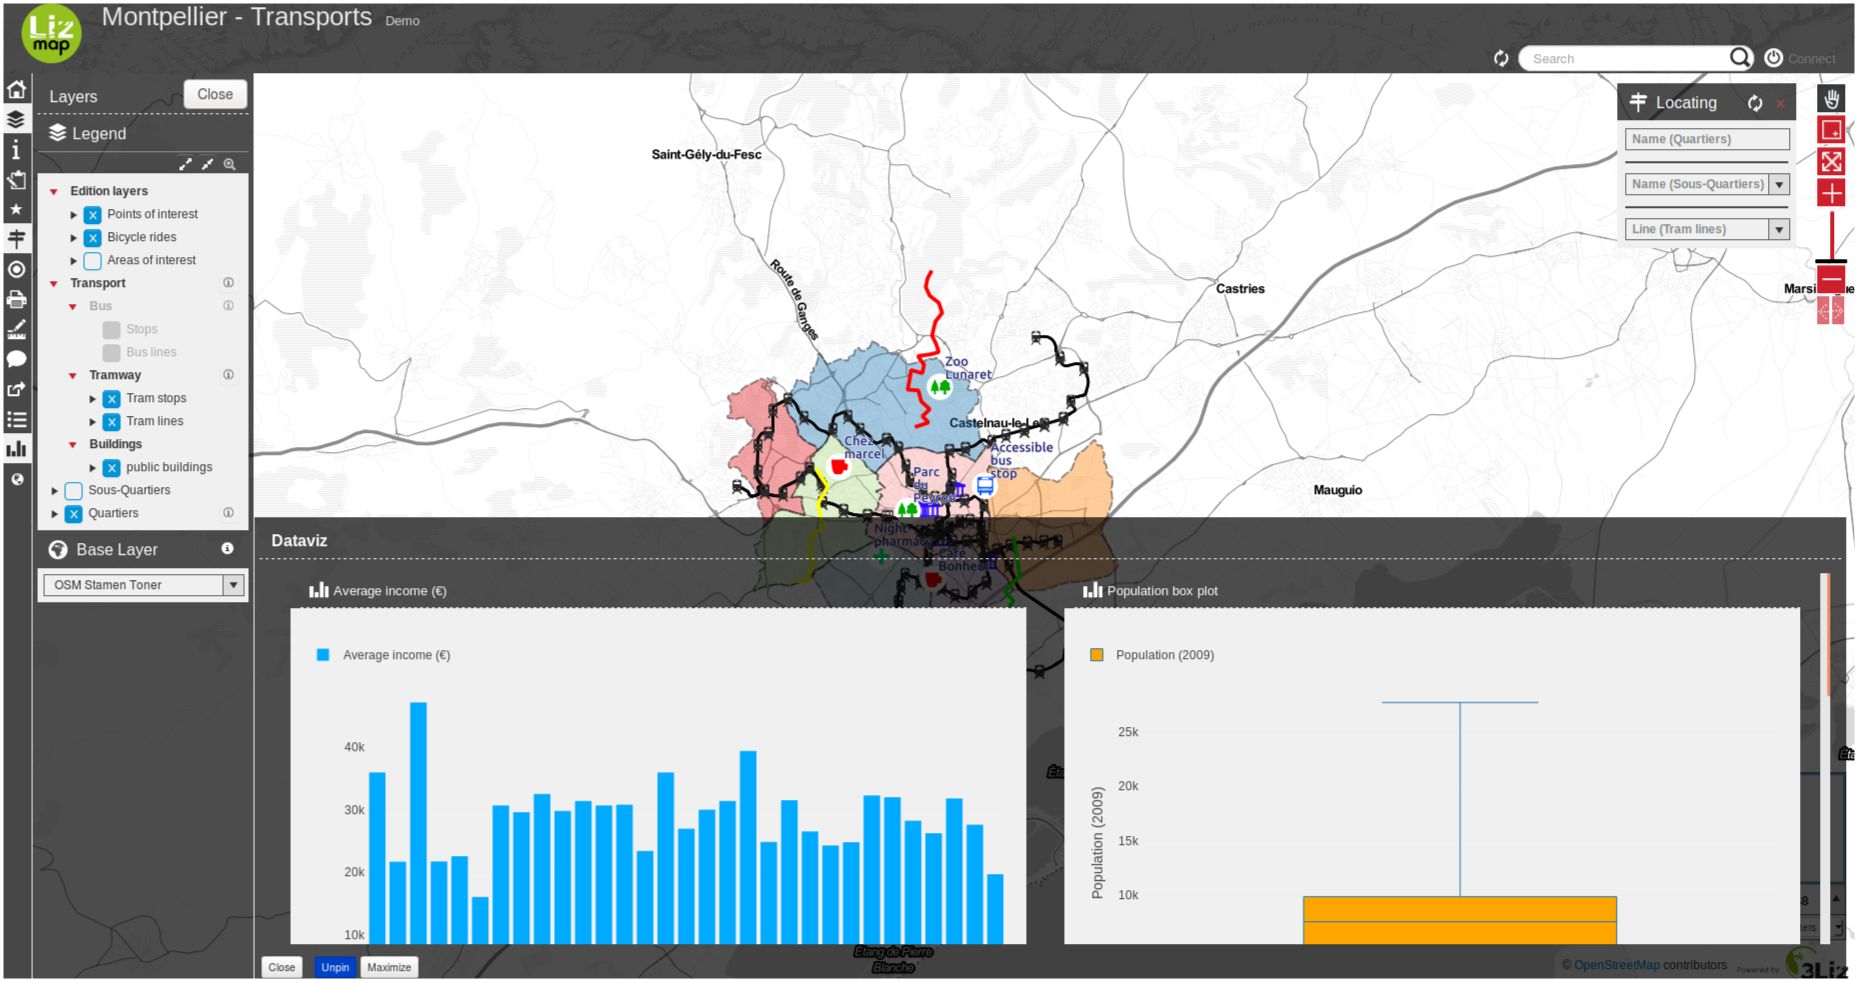
Avec le panneau de dataviz, vous pouvez créer des diagrammes en quelques clics:
dispersion
circulaire
histogramme
graphique en boîte
bar
histogramme 2D
polaire
sunburst
HTML
Pré-requis
La couche doit publiée en WFS (voir WFS/OAPI) et la clé primaire doit aussi être publiée dans les Propriétés de la couche.
Tutoriel vidéo
Cette vidéo est un démarrage rapide pour montrer les graphiques dans la popup des parents.
Configurer l’outil
Astuce
Vous pouvez commencer à utiliser le plugin DataPlotly pour créer votre graphique dans QGIS même. Ainsi, vous pouvez avoir un aperçu de ce qui est possible plus ou moins en matière de dataviz avec vos couches. Mais gardez à l’esprit que Lizmap et DataPlotLy, même s’ils utilisent le même moteur de dataviz (plotly), les fonctionnalités sont différentes entre ces deux outils.
Vous pouvez facilement le configurer avec l’extension Lizmap dans QGIS dans le panneau Dataviz.
Au niveau de la couche
Pour activer une couche avec des capacités de dataviz :
Cliquer sur le bouton
 .
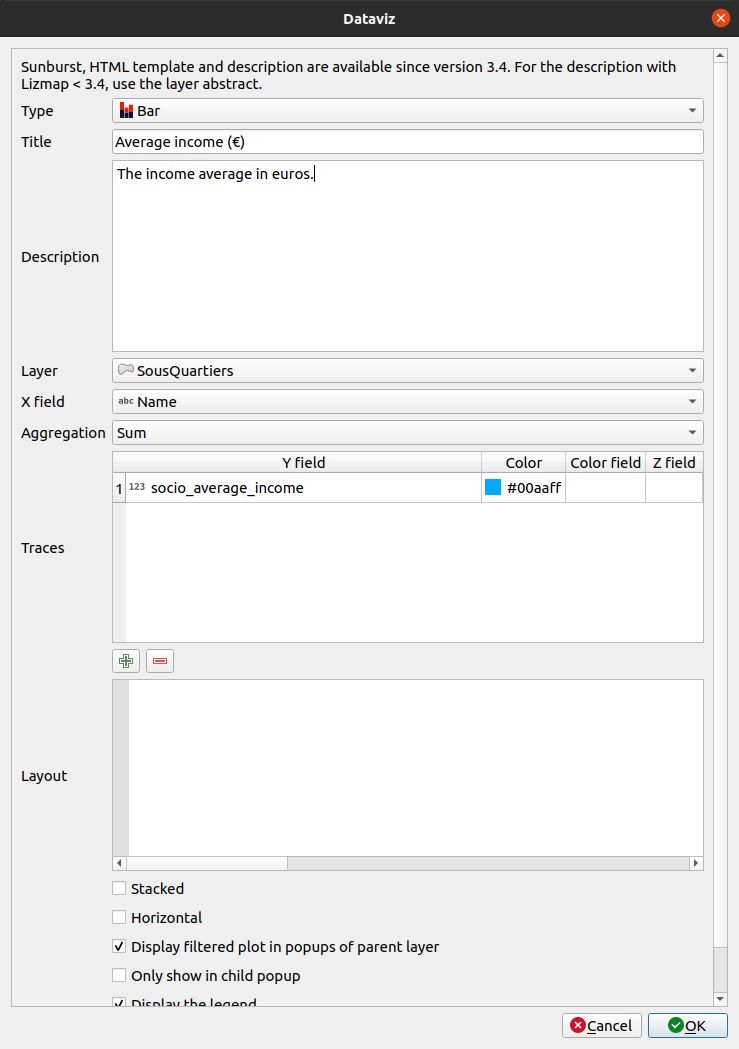
.Sélectionnez le type de graphique à ajouter. En fonction de vos choix, le formulaire s’adaptera de lui-même. Lisez ci-dessous les types de graphiques.
Titre : Ici vous pouvez écrire le titre que vous voulez pour votre graphique.
Description : La description du graphique. Vous pouvez inclure du HTML.
Sélectionnez la couche dans la liste déroulante.
Champ X : Le champ X de votre graphique. Il peut être vide pour quelques types.
- AggrégationPour certains types de graphiques, comme bar ou circulaire, vous pouvez choisir d’agréger les données
le graphique. Quelques fonctions d’agrégation sont disponibles : average(avg), sum, count, median, stddev, min, max, first, last.
Traces : Selon le type de graphe, vous pouvez ajouter une ou plusieurs traces : le champ Y de votre graphe.
Selon le type de graphique, il existe maintenant différentes options.
Mise en page : La présentation peut être personnalisée. Il doit s’agir d’un dictionnaire JSON. Vous pouvez lire la documentation de Plotly à propos de la configuration de la disposition.
Afficher le graphe filtré dans les popups de la couche parent : si vous cochez cette case, les enfants de votre couche obtiendront le même graphe que la couche parent mais filtré uniquement pour eux. C’est utile si vous voulez voir les statistiques d’une seule entité au lieu de toutes.
Montrer seulement dans la popup des enfants : Le graphique principal ne sera pas affiché dans le conteneur principal et seul le graphique filtré de la relation de la couche sera affiché dans la popup lorsque vous sélectionnez l’élément.
Afficher la légende, quelques fois, la légende n’est pas nécessaire.
Afficher le graphique seulement quand la couche est visible.
Certaines options peuvent être visibles ou pas selon le type de graphique, comme le choix d’une mise en page horizontale/verticale pour un graphique en barres.
Pour éditer une couche dans la table, sélectionner la et cliquer sur le bouton
 ou alors double-cliquer sur la ligne.
Pour supprimer une couche de la table, cliquez sur celle-ci puis sur le bouton
 .
.Pour monter ou descendre une couche, vous devez la sélectionner et cliquer
 ou
ou  . L’ordre changera dans Lizmap également.
Les alias des champs seront affichés si définis . Voir Ajouter un alias sur un champ.
Au niveau du projet
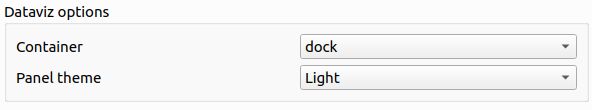
1. You have the possibility to change the value to dock, bottomdock or right-dock these options change where your dataviz panel will be located in your Lizmap’s project. You have 3 positions available, at the right of the screen, bottom and right.
2. You have the possibility to write in HTML the layout of the container of your charts. If you are proficient in the HTML language, there are a lot of possibilities and you can customize your container the way you want.
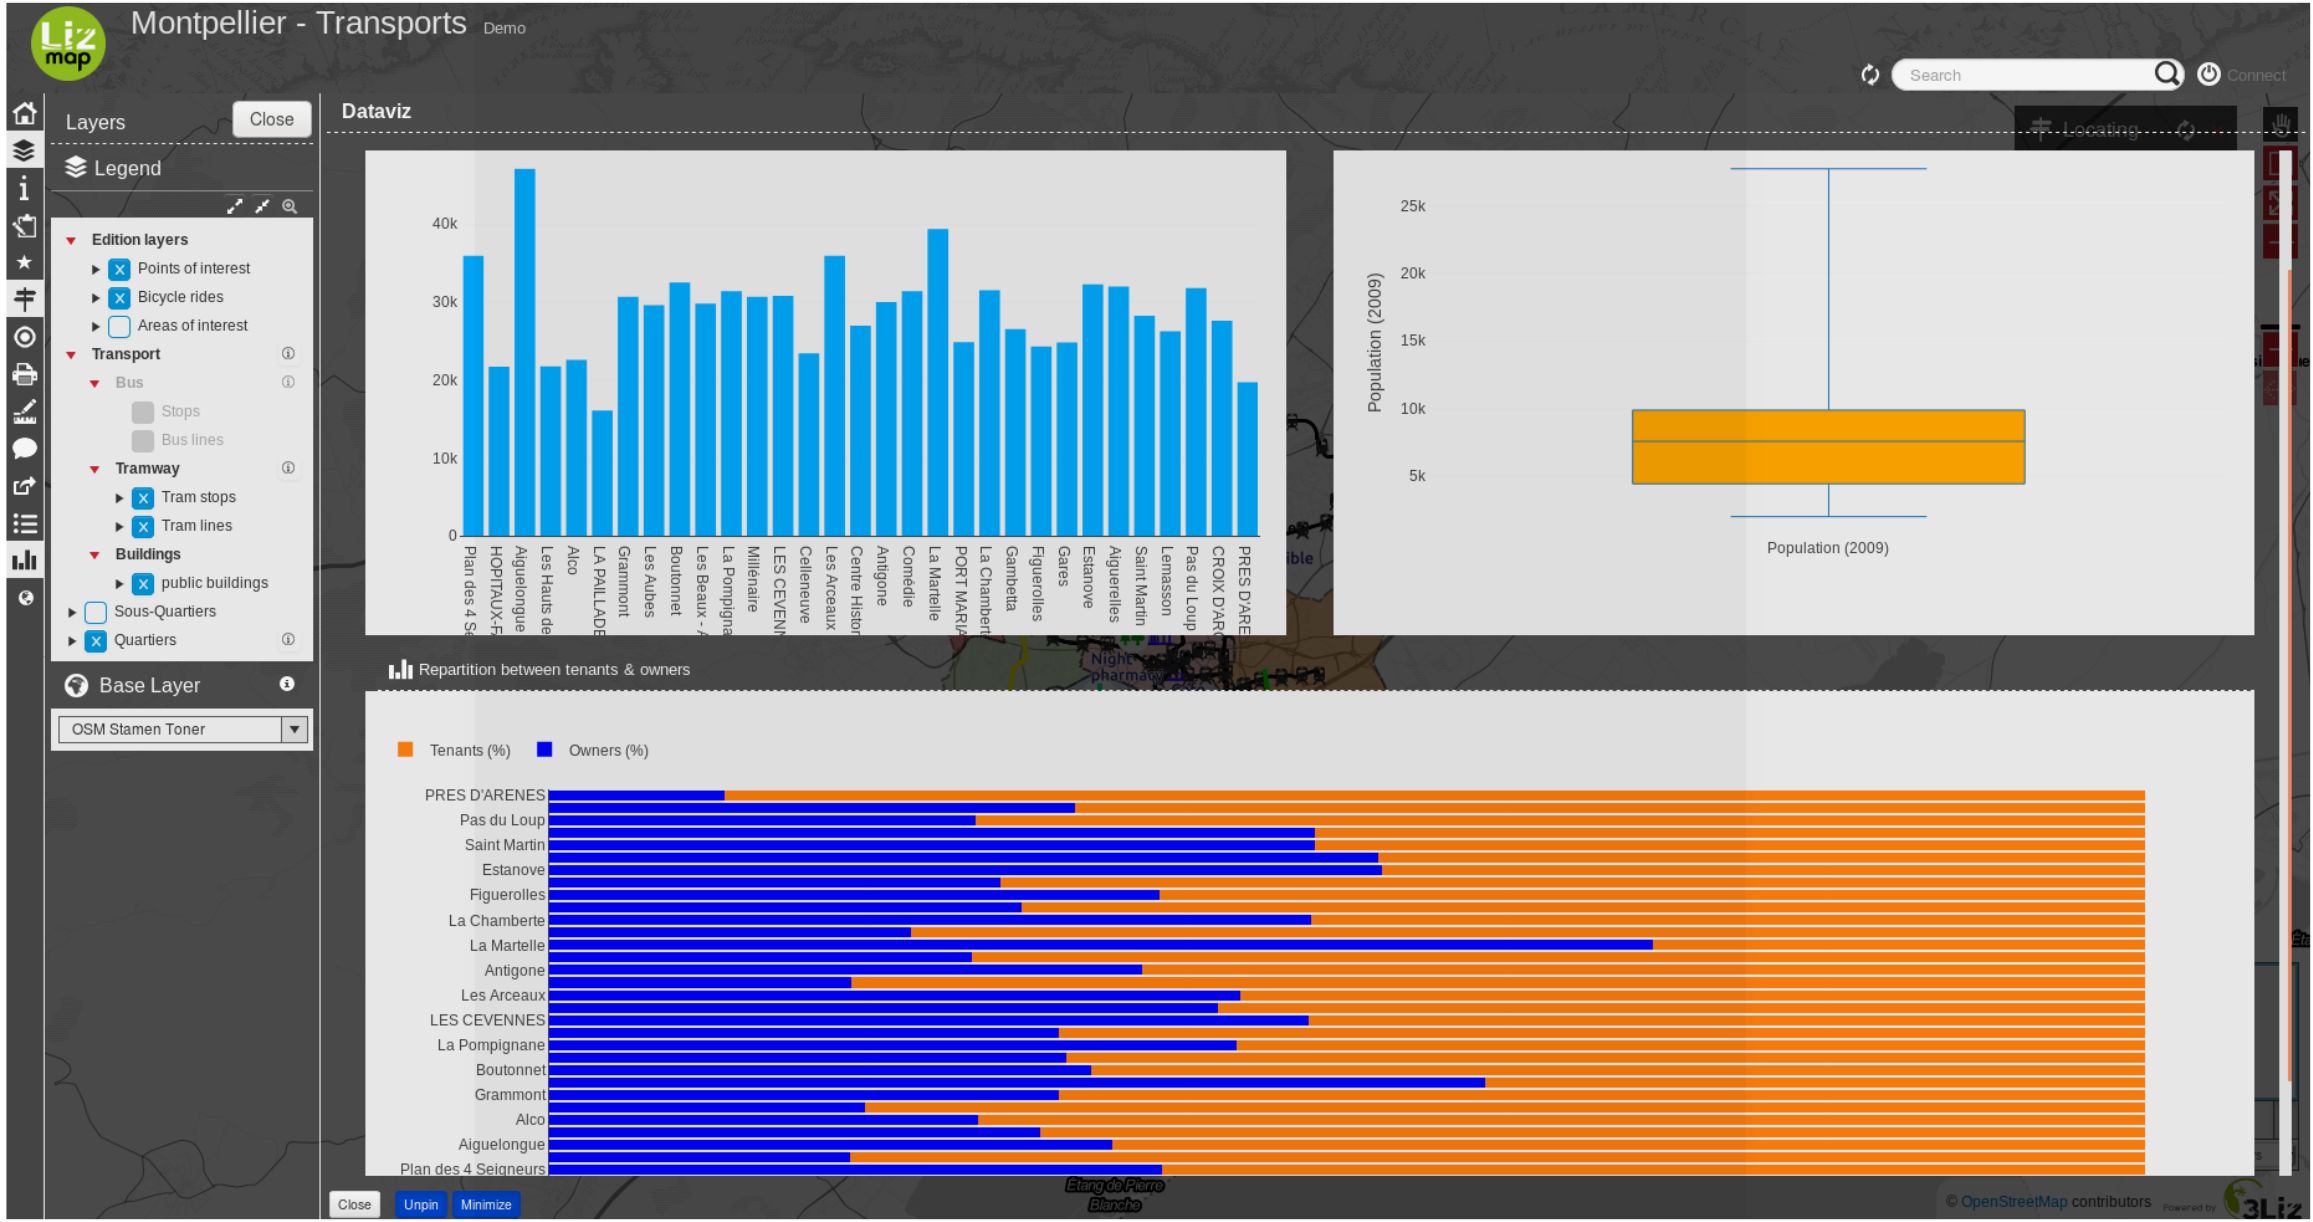
Ce code HTML bootstrap permet de produire la mise en page suivante:
<div class="container-fluid">
    <div class="row-fluid">
        <div class="span6">$0</div>
        <div class="span6">$1</div>
    </div>
    <div class="row-fluid">
        <div class="span12">$2</div>
    </div>
</div>
Mise en page JSON
L’option layout, vous permet de configurer de nombreuses options en écrivant un objet JSON. Voir la référence complète sur la documentation Plotly.
Les exemples suivants montrent comment utiliser des propriétés dépendant de la propriété de la mise en page:
Ajouter des unités sur l’axe Y (vertical) :
// Add " ha" suffix
{"yaxis": {"ticksuffix": " ha"}}
Supprimer les étiquettes sur l’axe X (horizontal):
// Hode X labels. Use yaxis for Y labels
{"xaxis": {"showticklabels": false}}
Suppression du suffixe automatique k, M ou G (ex : 10 M) pour les grands nombres dans l’axe et dans l’info-bulle du survol :
{"yaxis": {"tickformat": ",.2f"}}
Ordre des barres d’un graphique à barres. Utilisez des valeurs ascendantes ou descendantes :
// By ascending X value
{"xaxis": {"categoryorder": "category ascending"}}

// By descending bar height (total Y value)
{"xaxis": {"categoryorder": "total ascending"}}
Définissez les marges. Utilisez l pour la gauche, t pour le haut, r pour la droite et b pour le bas :
// Shift the plot to the right (to display big Y axis labels)
{"margin": {"l": 70}}
Définir les propriétés de la police :
// Change X axis font size
{"xaxis": {"tickfont": {"size": 10}}}
Vous pouvez combiner toutes les propriétés, par exemple :
{
    "xaxis": {
        "categoryorder": "total ascending"
        "tickfont": {
            "size": 10
        }
    },
    "yaxis": {
        "showticklabels": false
    }
}
Autres personnalisations avec des scripts JavaScript
Nous pouvons également modifier les graphiques avec quelques scripts JavaScript.
Vous pouvez décider de ne pas mettre de chiffre après la virgule pour le premier graphique (ID
dataviz_plot_0), par exemple :
lizMap.events.on({
    'datavizplotloaded': (evt) => {
        if( evt.id === 'dataviz_plot_0'){
            Plotly.restyle( evt.id, {
                texttemplate: "%{value:.0f}"
            });
        }
    }
});
Vous pouvez décider d’afficher lignes et marqueurs (documentation) pour un diagramme de dispersion (ID
dataviz_plot_1), par exemple :
lizMap.events.on({
    'datavizplotloaded': (evt) => {
        if( evt.id === 'dataviz_plot_1'){
            Plotly.restyle( evt.id, {
                mode: "lines+markers"
            });
        }
    }
});
Types de graphiques
Le module dataviz va agréger toutes les traces pour toutes les valeurs uniques X.
Modèles HTML
Une trace doit être référencée par {$y1}` où 1` est le numéro de la trace dans le tableau.
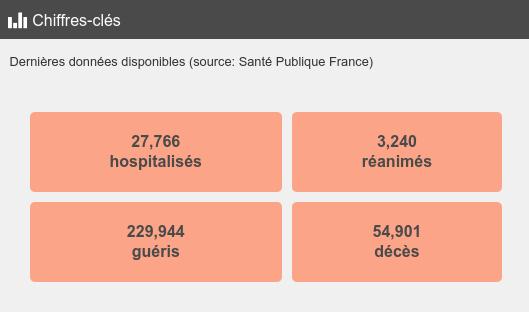
L’exemple ci-dessous produira une boîte colorée unique, similaire à la démo COVID.
<style type="text/css">
table.example-table {
    width: 100%;
    font-weight: bold;
    color:#4a4a4a;
    padding: 10px;
    border-spacing: 10px;
    border-collapse: separate;
}
table.example-table tr td {
    background-color: #fca487;
    border-radius: 5px;
    border: 10px solid #fff0;
    padding: 10px;
    margin: 10px;
    text-align: center;
}
</style>
<table class="example-table">
    <tbody>
        <tr>
            <td>{$y1}</td>
        </tr>
    </tbody>
</table>
Rayons de soleil (sunburst)
Jetez un coup d’œil au graphique Sunburst sur la couche Postes clés dans la démo occupation du sol.
Divers
Pour le graphique pie : les éléments de la légende sont classés par X par défaut.
Les aliases des champs QGIS sont utilisées dans l’info-bulle lors du survol de la barre ou des parties du camembert.
Exemples
Vous pouvez visiter le projet des Chats.