Time Manager — Animation of temporal vector layers
Principle
You can create animations of your vectors, provided you have at least a layer with a column with a valid date/time.
Example
On the demo website, look at the Earthquake in Indonesia. You can download the QGIS project to see how it’s done.
A video tutorial is available. It shows all the steps to use the functionality.
Prerrequisitos
The layer must be published as WFS (see WFS/OAPI) and the primary key must be published as well in the Layer properties.
Configuring the tool
After the configuration, your web application will display the symbol of a watch; clicking on it will open a small panel that will allow you to move between steps, or play the entire animation. At startup, the application will load the entire table, so if you have thousands of objects you may need to wait for several seconds before the application is available.
Nota
Several different formats for date/time are acceptable (those supported by the JavaScript library Moment). You can check whether your format is supported by reading the documentation on Moment.
At the layer level

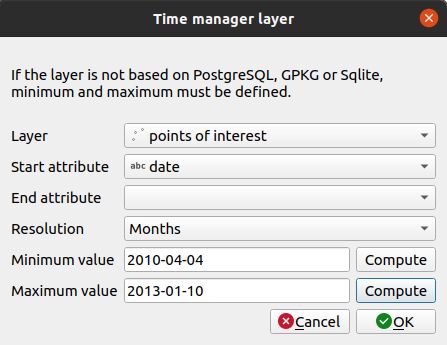
For setting the time manager with one layer:
Click the
button.
One layer with date/time capabilities.
The start column with date/time. It can any kind of fields.
The end column with date/time. This is optional.
Date/time resolution of the chosen attribute(s).
For not database based layer, you must compute the minimum and maximum values.
Advertencia
Date/time resolution can have a different value than Frame type. You might select years for Frame type
but your date field could have a Days resolution.
To edit a layer in the table, select it and click the
button or double click on the row.
To remove a layer from the table, select it and click the
button.
To move a layer up or down, select it and click
or
buttons. The order will change in Lizmap too.
At the project level

Options:
Time frame size
Frame type
Animation frame length
