Advanced Configuration
Criar um mapa de enquadramento
Para adicionar um mapa de enquadramento*, ou mapa de localização, a um mapa Lizmap, deve:
Create an independent group in the QGIS project called Overview (with the 1st letter capitalized)
Adicionar camadas, por exemplo, uma camada de municípios, uma camada base respeitante ao terreno, etc.
All layers and groups in the Overview group will not be shown in the lizmap’s map legend. They are drawn only in the Overview map.
É aconselhável utilizar:
camadas vetoriais leves e simplificadas (se necessário)
utilize uma simbologia adequada: traços pequenos e etiquetas simples ou ocultas
Aqui está um exemplo de utilização:
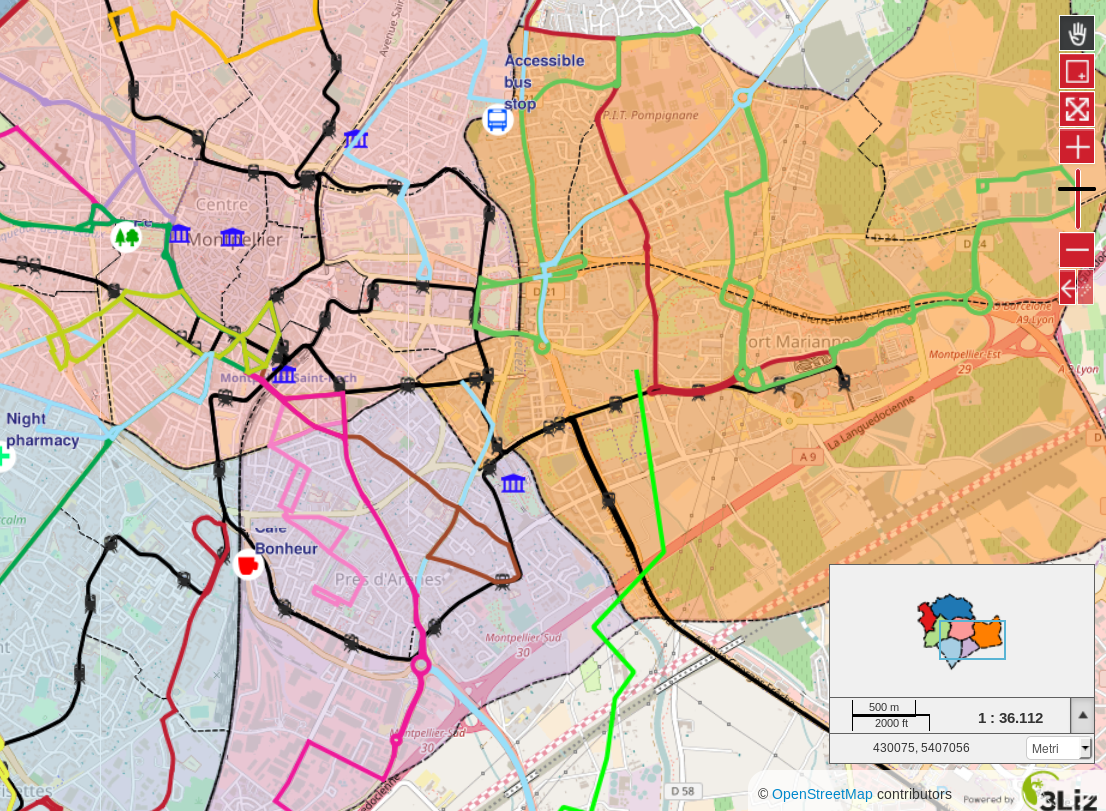
Add the localization function
A ideia desta ferramenta é apresentar ao utilizador do Lizmap Web Client uma lista de valores que oferece a capacidade de fazer zoom para um ou mais objetos espaciais da camada.
Caso de utilização
Considere uma camada espacial vetorial districts contida no projeto QGIS. Optamos por adicionar esses distritos à ferramenta Localizar por camada, para permitir aos utilizadores do Lizmap Web Client que se possam posicionar rapidamente num dos distritos.
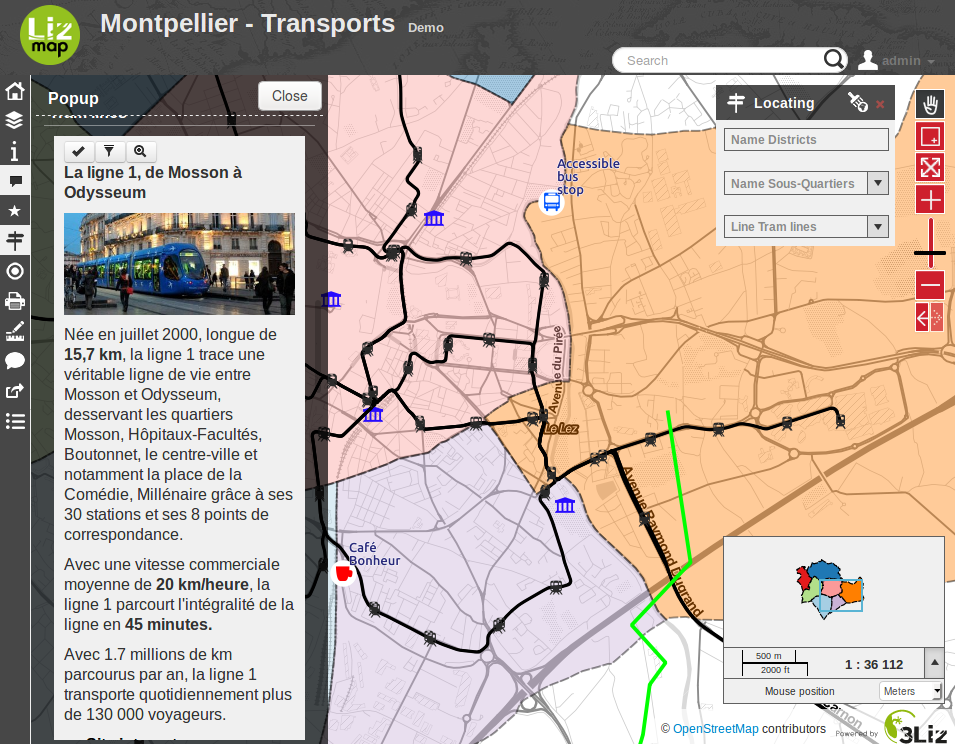
Depois desta camada ser adicionada à ferramenta Localizar por camada, aparecerá na interface do Lizmap Web Client uma lista de valores contendo os distritos.
Quando o utilizador do mapa Web seleciona um nome nessa lista, o mapa será automaticamente reorientado para o distrito selecionado e a geometria do distrito será exibida (opcional).
Pré-requisitos
Nota
The layer(s) you want to use must be published as WFS layer: check the corresponding box of the WFS capabilities in the OWS Server tab of the Project Properties window.
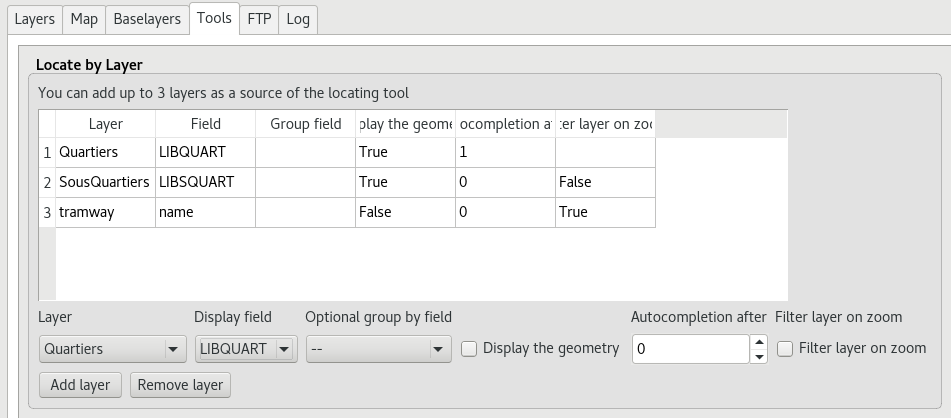
How to
Para adicionar uma camada a esta ferramenta:
escolha a camada com a primeira lista de valores da lista de camadas vetoriais do projeto
depois a coluna que contém os valores que deseja apresentar na respetiva lista
Se desejar que a geometria dos objetos relacionados também seja mostrada no mapa quando o utilizador seleciona um item da lista, marque a opção Mostrar a geometria
finally click the button Add layer to add it to the list.
To remove a layer already configured:
select the line of the layer you want to remote by clicking on it
click on the button Remove layer.
Listas hierárquicas
Se tomarmos o exemplo dos distritos, pode ser interessante também fornecer ao utilizador uma caixa de valores concelhos. Pretende-se que, quando o utilizador escolhe um distrito, a caixa de valores dos concelhos seja automaticamente filtrada para mostrar apenas os concelhos do distrito escolhido.
Para isto, existem 2 métodos:
ou tem 2 camadas vetoriais separadas: uma para distritos e outra para concelhos. Nesse caso deverá utilizar um campo de união entre as duas camadas para ativar as listas de filtragem automática no Lizmap
ou temos apenas 1 camada para concelhos e, então, pode especificar através do plugin um campo de agrupamento. Serão criadas duas caixas de valores em vez de uma na aplicação da Web.
Nota
Up to 3 project layers can be added to the Locate by layer tool.
Nota
Don’t forget to check if your configuration of Qgis server is the right one (in Lizmap : My account -> Lizmap configuration -> check if the qgis server version is the right one, if not, you can use the button “modify” below). If the configuration is not right the location will be wrong!
Spatial searching
In the map options, you can activate and configure the address search bar, based on external web services (nominatim, google or french IGN). See Configure the map . Additonaly, you can add spatial searching capability to Lizmap. This means you will allow the users to search within spatial data, such as countries, points of interests, etc. You have two ways to add searching capability in Lizmap:
since version 3.1, you can use the plugin QuickFinder to configure a data search per QGIS project.
since version 3.2, you can create a table or view lizmap_search in your PostgreSQL database to store the search data for all your Lizmap projects.
QuickFinder Plugin
O objetivo deste plugin é proporcionar uma pesquisa rápida entre grandes conjuntos de dados, pesquisando dentro de um ficheiro qtfs gerado através do QGIS Desktop.
Pré-requisitos
You must have install at least the 7.x version of PHP in your Lizmap server.
It is available only since version 3.1 of Lizmap Web Client.
Configuration
Dentro do QGIS
install QuickFinder Plugin
choose a layer(s), define the fields to search among, pick the geometry storage format (WKT or Extent) and store Full Text Searchs (FTS) vector into a file database (.qfts). The filename must be identical to the QGIS project filename. Ex: myproject.qfts for a QGIS project stored as myproject.qgs
Nota
Apenas funcionam os formatos WKT ou Extent para armazenamento das geometrias, uma vez que o formato binário (WKB) não pode ser descodificado pelo LWC.
Inside LWC (available since version 3.1):
colocar o ficheiro da base de dados na pasta onde se encontra o projeto QGIS, utilizar a ferramenta de pesquisa (pesquisar) e fazer zoom para o elemento escolhido.
PostgreSQL search
When you have many projects and data, the best solution to provide searching capabilities is to set up a dedicated relation (table or view) inside your database. Since version 3.2, Lizmap allows to use a PostgreSQL database to store the search data.
Pré-requisitos
a PostgreSQL database, accessible from Lizmap Web Client
PostgreSQL extensions activated in this database : unaccent and pg_trgm (for effective LIKE queries)
A custom function f_unaccent which can be used in an index. See this Stack Overflow post for explanation
-- Add the extension pg_trgm
CREATE EXTENSION IF NOT EXISTS pg_trgm;

-- Add the extension unaccent, available with PostgreSQL contrib tools. This is needed to provide searches which are not sensitive to accentuated characters.
CREATE EXTENSION IF NOT EXISTS unaccent;

-- Add the f_unaccent function to be used in the index
CREATE OR REPLACE FUNCTION public.f_unaccent(text)
RETURNS text AS
$func$
SELECT public.unaccent('public.unaccent', $1)  -- schema-qualify function and dictionary
$func$ LANGUAGE sql IMMUTABLE;
Nota
We choose to use the pg_trgm extension and this custom f_unaccent function instead of the Full Text Search (FTS) tool of PostgreSQL, to keep the tool as simple as possible and avoid the need to create FTS «vectors» in your search data.
Create the lizmap_search table or view
The database admin must create a table, view or materialized view called lizmap_search. This relation must be accessible in the search_path (you can put it in the public schema, or configure the search_path variable for the database or the user which connects to the database).
The relation «lizmap_search» must contain the following columns:
item_layer (text). Name of the layer. For example «Countries»
item_label (text). Label to display the results, which is the data to search among. Ex: «France» or «John Doe - Australia». You can build it from a concatenation of several fields values.
item_project (text). List of Lizmap projects separated by commas. Optionnal. When set, the search will be done only for the specified Lizmap projects
item_filter (text). Username or group name. When given, the results will be filtered by authenticated user login and groups. For example, “admins”
geom (geometry). We advise to store all the geometries with the same SRID.
Here is an example of SQL code you can use, to add data from two different spatial tables into lizmap_search (here as a materialized view to ease further maintenance)
DROP MATERIALIZED VIEW IF EXISTS lizmap_search;
CREATE MATERIALIZED VIEW lizmap_search AS
SELECT
    'Commune' AS item_layer, -- name of the layer presented to the user
    concat(idu, ' - ', tex2) AS item_label, -- the search label is a concatenation between the 'Commune' code (idu) and its name (tex2)
    NULL AS item_filter, -- the data will be searchable for every Lizmap user
    NULL AS item_project, -- the data will be searchable for every Lizmap maps (published QGIS projects)
    geom -- geometry of the 'Commune'. You could also use a simplified version, for example: ST_Envelope(geom) AS geom
FROM cadastre.geo_commune
UNION ALL -- combine the data between the 'Commune' (above) and the 'Parcelles' (below) tables
SELECT
    'Parcelles' AS item_layer,
    concat(code, ' - ', proprietaire) AS item_label,
    'admins' AS item_filter, -- only users in the admins Lizmap group will be able to search among the 'Parcelles'
    'cadastre,urban' AS item_project, -- the Parcelles will be available in search only for the cadastre.qgs and urban.qgs QGIS projects
    geom
FROM cadastre.parcelle_info
;
Optimisation
You should use a table, or a materialized view, on which you can add indexes to speed up the search queries.
We strongly advise you to add a trigram index on the unaccentuated item_label field, to speed up the search query:
-- Create the index on the unaccentuated item_label column:
DROP INDEX IF EXISTS lizmap_search_idx;
CREATE INDEX lizmap_search_idx ON lizmap_search USING GIN (f_unaccent(item_label) gin_trgm_ops);

-- You can refresh the materialized view at any time (for example in a cron job) with:
REFRESH MATERIALIZED VIEW lizmap_search;
At present, Lizmap PostgreSQL search cannot use 3D geometries, or geometries with Z or M values. You have to use the ST_Force2D(geom) function to convert geometries into 2D geometries.
Configure access
Once this table (or view, or materialized view) is created in your database, you need to check that Lizmap can have a read access on it.
If your Lizmap instance uses PostgreSQL to store the users, groups and rights, a connection profile already exists for your database. Then you can just add the lizmap_search relation inside this database (in the public schema).
If not, or if you need to put the search data in another database (or connect with another PostgreSQL user), you need to add a new database connection profile in Lizmap configuration file lizmap/var/config/profiles.ini.php. The new profile is a new jdb prefixed section, called jdb:search. For example, add the following section (please replace the DATABASE_ variables by the correct values):
[jdb:search]
driver="pgsql"
database=DATABASE_NAME
host=DATABASE_HOST
user=DATABASE_USER
password=DATABASE_PASSWORD
; search_path=DATABASE_SCHEMA_WITH_LIZMAP_SEARCH,public
You don’t need to configure the locate by layer tool. You can now use the default search bar in lizmap.

Media in Lizmap
Use principle
É possível fornecer documentos através do Lizmap. Para fazer isso, de forma simples:
create a directory called media (in lower case and without accents) at the same level as the QGIS project
place documents in it: pictures, reports, pdfs, videos, HTML or text files
the documents contained in this media directory must be synchronized as other data
you can use subdirectories per layer or theme: the organization of media directory content is free.
Em seguida, no Lizmap Web Client pode fornecer acesso a esses documentos por 2 formas:
the popups: the content of one or more field for each geometry can specify the path to the media. For example a photo or pdf field
the link provided for each group or layer in the Lizmap plugin Layers tab.
Os detalhes destas utilizações são especificados abaixo.
Utilização de links
It is possible to use a relative path to a document for layers or groups link.
Nota
Links can be filled with the Lizmap plugin Layers tab after selecting the layer or group. See Configurar as suas camadas Web
O caminho deve ser escrito:
starting with media/
with slashes / and not backslashes
Alguns exemplos:
media/my_layer/metadata_layer.pdf
media/reports/my_report_on_the_layer.doc
media/a_picture.png
No mapa do Lizmap Web Client, será colocado um ícone (i) à direita das camada caso tenha sido configurado um link dessa forma para uma das camadas. Ao clicar neste ícone abrir-se-á o documento respetivo num novo separador do navegador.
Utilização de popups
Princípio
Conforme descrito na introdução acima, é possível utilizar um caminho media na camada de dados espaciais.
Por exemplo, se quiser que as popups associados a uma camada mostrem uma imagem que depende de cada objeto, basta criar um novo campo que conterá o caminho do diretório media para a imagem em cada linha da tabela de atributos da camada e ativar popups para essa camada.
Exemplo
Here for example the attribute table of a layer landscape configured to display pictures in the popup. The user has created a picture field in which he places the path to the pictures, and a pdf field in which he puts the paths to a pdf file describing the object corresponding to each line.
id |
nome |
descrição |
imagem |
|
|---|---|---|---|---|
1 |
Pântano |
blabla |
media/photos/photo_1.png |
media/docs/paysage-1.pdf |
2 |
Praia |
blibli |
media/photos/photo_2.png |
media/docs/paysage-2.pdf |
3 |
Ancoradouro |
bloblo |
media/photos/photo_3.png |
media/docs/paysage-3.pdf |
Nota
In this example, we see that the pictures and pdf file names are normalized. Please follow this example because it allows using the QGIS Field Calculator to create or update automatically the media column data for the entire layer.
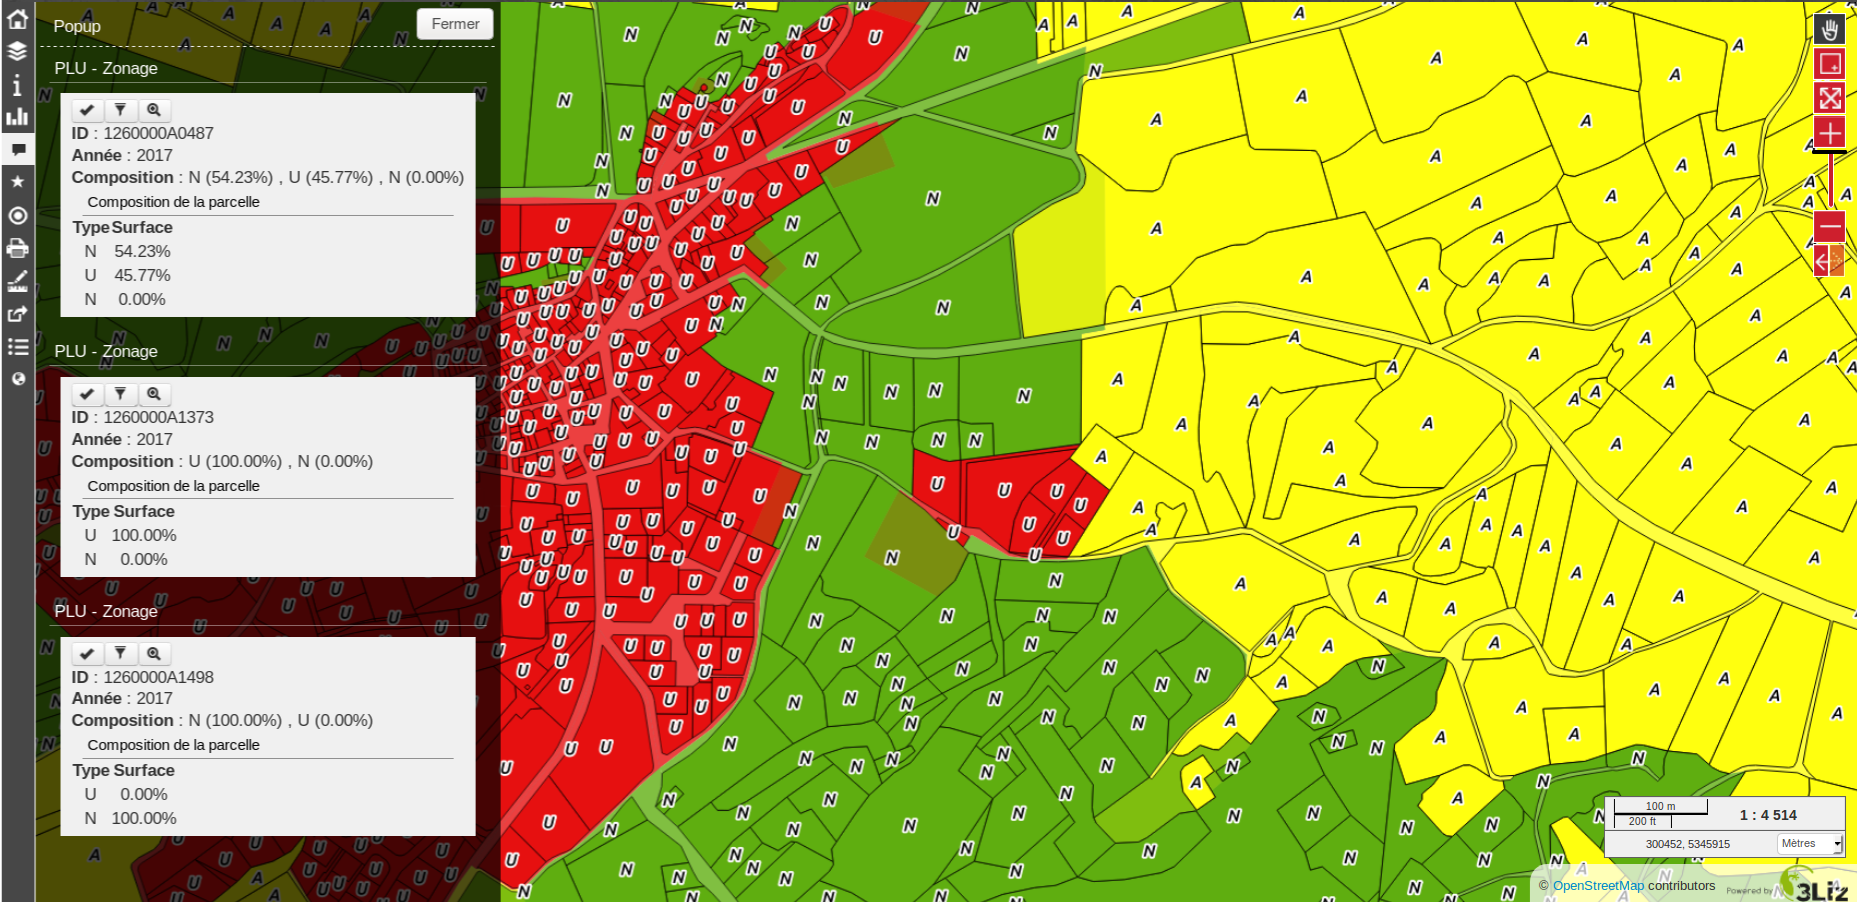
Resultado
Aqui estão as regras de apresentação em popup:
if the path points to a picture, the image will be displayed in the popup. Clicking on the picture will display the original image in a new tab
if the path points to a text file or HTML file, the file contents will be displayed in the popup
for other file types, the popup will display a link to the document that users can download by clicking on the link.
Ilustração
Abaixo está uma ilustração de uma popup do Lizmap mostrando uma imagem, um texto e um link na popup:
How to configure popups
Activate popups
With the plugin, you can activate popups for a single layer or for a group configured with the «Group as layer» option.
Just click on the checkbox Activate popups of the tab Layers on the Lizmap plugin interface. For the Group as layer option you must select the option for the group and for all the layers included you want to show in the popup: in this case, only the layers with the option Popup checked will be shown.
Existem três tipos de fontes popup:
auto
lizmap
qgis
In the web application Lizmap Web Client, a click on a map object will trigger the popup if (and only if):
a camada estiver ativada na legenda, para que a mesma seja mostrada no mapa
the popup has been activated through the plugin for the layer or the group
o utilizador clicou numa área do mapa onde os dados da camada com popups ativas são apresentados.
Nota
For point layers you need to click in the middle of the point to display the popup. The tolerance can be setup in tab Map options then Map tools.
You can update where the popup is displayed in the web interface in Map options then Map interface. You can choose between:
dock
minidock
map
bottomdock
right-dock
Auto popup
The Lizmap Web Client auto popup displays a table showing the columns of the attribute table in two columns Field and Value, as shown below:
Campo |
Valor |
|---|---|
id |
1 |
nome |
Nome |
descrição |
Este objeto … |
foto |
:-) |
Pode modificar as informações apresentadas através do QGIS e também mostrar imagens ou links.
Configuração popup simples
Através do plugin, se clicar na caixa de verificação Ativar popups sem modificar seu conteúdo através do botão Configurar será apresentada a tabela padrão.
No entanto, pode sincronizar vários aspetos no QGIS e com a ajuda do plugin Lizmap para parametrizar os campos apresentados, renomear campos, e até mesmo apresentar imagens, fotos ou links para documentos internos ou externos.
Ocultar ou renomear uma coluna
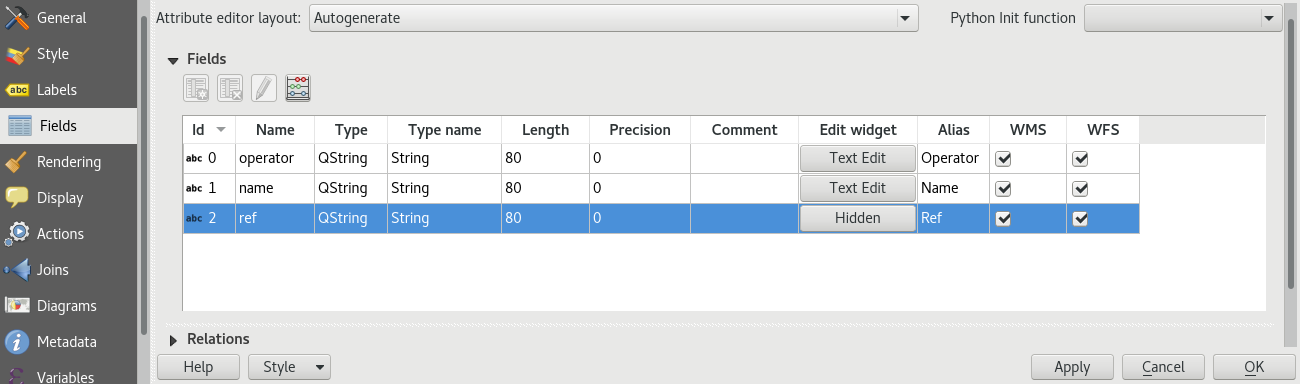
You can use the tools available in the Fields tab of the Layer properties, in QGIS:
to avoid displaying a column in the popup, uncheck the relative WMS checkbox. The WMS column is on the right
to change the name displayed for that column, type a different name in the Alias column
Utilização de formatos média: imagens, documentos, etc.
If you use paths to documents of the media directory, you can:
display the image found at that link
display the content (text or HTML) of the file
display a link to a document
Veja também
Chapter Media in Lizmap for more details on the usage of documents of the directory media in the popups.
Utilização de links externos
Também pode utilizar, num campo, links web completos para uma página ou imagem específica:
a imagem referida será apresentada, em vez do link
o link web será mostrado de forma clicável
Lizmap popup
Introdução
If the simple table display does not suit your needs, you can write a popup template. To do so, you should know well the HTML format. See e.g.: http://html.net/tutorials/html/
Aviso
Quando utiliza o modo lizmap, a configuração anterior para renomear um campo deixa de funcionar: é necessário configurar o que é mostrado e como através do modelo. Também é possível a gestão de média, mas para isso é preciso ser configurada.
Implementação
Pode editar o modelo popup com o botão Configurar no plugin Lizmap. Clicando no mesmo, será apresentada uma janela com duas áreas de texto:
uma área onde pode digitar o seu texto
uma área apenas de leitura, mostrando uma visualização prévia do seu modelo
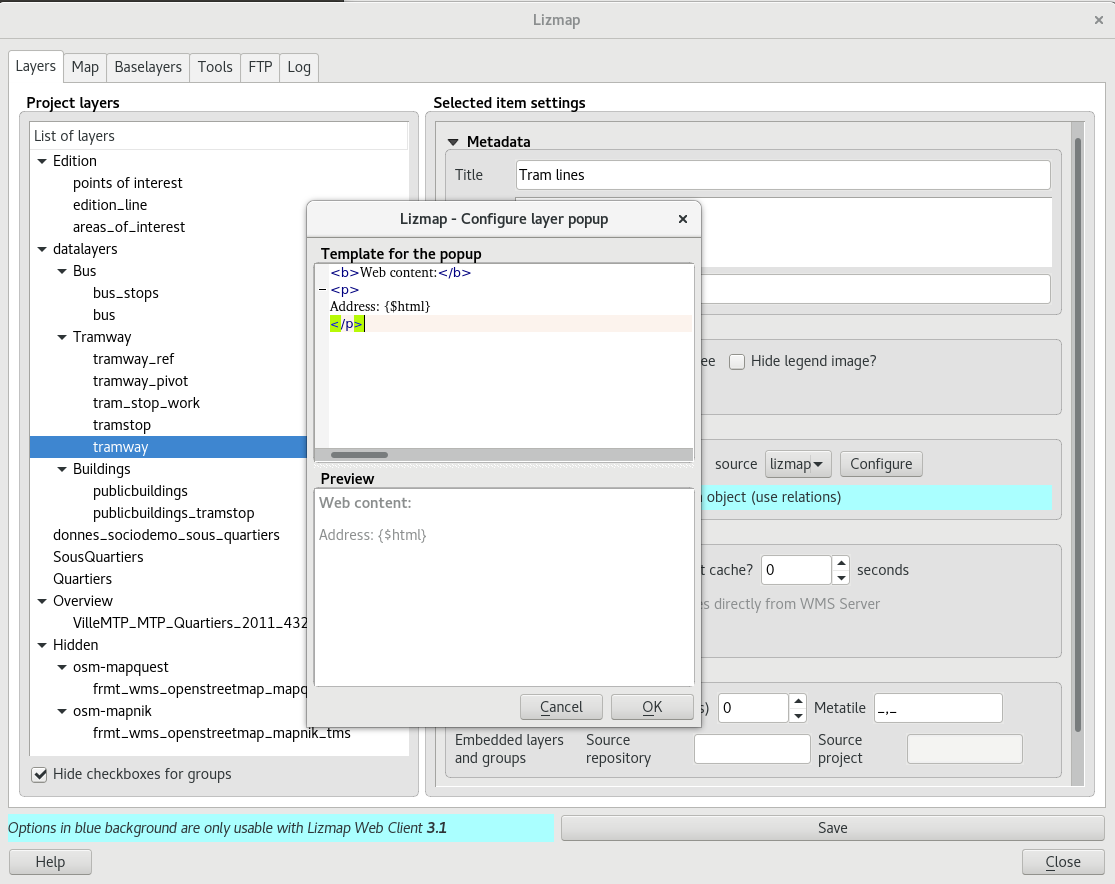
Pode digitar texto simples, mas sugerimos que escreva em formato HTML para dar uma formatação adequada. Por exemplo, pode adicionar parágrafos, cabeçalhos, etc .:
<h3>A Title</h3>
<p>An example of paragraph</p>
O comportamento é o seguinte:
se o conteúdo das duas áreas estiver vazio, será apresentada uma tabela simples na popup (modelo padrão)
se o conteúdo não estiver vazio, o seu conteúdo será utilizado como um modelo para a popup
O Lizmap Web Client substituirá automaticamente uma variável, identificada pelo nome de um campo, pelo seu conteúdo. Para adicionar o conteúdo de uma coluna a uma popup, deve utilizar o nome da coluna precedida do símbolo dólar ($), tudo entre chavetas ({}). Por exemplo:
<h3>A Title</h3>
<p>An example of paragraph</p>
<p>A name: <b>{$name}</b></p>
<p>Description: {$description}</p>
Nota
Se configurou um alias para um campo, deve utilizar esse alias em vez do nome, entre parênteses retos
Também pode utilizar os valores das colunas como parâmetros para atribuir estilo ao texto. Como exemplo, para utilizar a cor de uma linha de autocarro como uma cor de fundo:
<p style="background-color:{$color}">
<b>LINE</b> : {$ref} - {$name}
<p/>
Utilização de média e links externos
Pode utilizar o recurso média referido no conteúdo da tabela, mesmo se utilizar um modelo. Para fazer isso, deve utilizar a coluna de média, tendo em conta o fato de que o Lizmap Web Client substitui automaticamente o caminho relativo do tipo /media/myfile.jpg pelo URL completo do ficheiro, acessível através da interface web.
Também pode utilizar URLs completos apontando para as páginas ou imagens alojadas noutro servidor.
Um exemplo de um modelo de manipulação de média e um link externo:
 <p style="font-size:0.8em;">A Title</p>
 <p>The name is {$name}</p>
<p>
   A sample image<br/>
   <img src="{$image_column}" style="">
 </p>

 <p><a href="{$website}" target="_blank">Web link</a></p>

 <p><img src="http://www.3liz.com/assets/img/logo.png"/></p>
Veja também
Chapter Media in Lizmap for more details on the use of documents in the directory media.
popup QGIS
QGIS popups can be configured via QGIS –> Layer properties –> Tooltips –> HTML, using the same syntax as for the lizmap popups. The main advantages of this approach are:
pode utilizar variáveis e expressões QGIS, adicionando informações criadas dinamicamente
the popup can be previewed in QGIS, using tooltips
as configurações popup e estilo das camada são armazenados no projeto QGIS, para que possam ser reutilizados em outros projetos Lizmap sem replicar a configuração.
Relações de um para vários
It is possible to display multiple objects (photos, documents) for each geographical feaature. To do so, you have to configure both the QGIS project and the Lizmap config.
No projeto QGIS:
Use 2 separate layers to store the main features and the pictures. For example «trees» and «tree_pictures». The child layer must contain a field referencing the parent layer id
Configure aliases and field types in tab Fields of the layers properties dialog. Use «Photo» for the field which will contains the relative path to pictures
Add a relation in QGIS project properties between the main layer «trees» and the child layer «tree_pictures»
Add data to the layers. You should use relative path to store the pictures path. Theses paths must refer to a project media subdirectory, for example: media/photos/feature_1_a.jpg
No plugin Lizmap:
In the Layers tab, activate popup for both layers. You can configure popup if you need specific layouts ( See documentation on popups )
For the parent layer, activate the option «Display relative children under each object (use relations)»
Add the two layers in the Attribute table tab
Opcionalmente pode ativar a edição para as duas camadas, para permitir que os utilizadores web criem novos elementos e façam o upload de imagens
Guarde e publique seu projeto com a configuração do Lizmap
Link of an element for layers with an atlas
Every element of a layer with an atlas configured will have a link at the end of his popup which open a pdf of the atlas for this particular element. To make it work you will need to download the «atlas_print» plugin, for that you have to get it from his Github at : https://github.com/3liz/qgis-atlasprint
Mostrar subordinados em formato compacto
É possível altera a forma como os elementos subordinados são apresentados e fazê-las parecer uma tabela. Para isso, é necessário adaptar o HTML de camada subordinada e utilizar algumas classes para manipulação do código.
«lizmap_merged»: É necessário atribuir esta classe à tabela
lizmapPopupHeader: Se desejar uma apresentação melhorada dos cabeçalhos, é necessário colocar esta classe no “<tr>” que os contém
lizmapPopupHidden: Esta classe permite ocultar alguns dos elementos subordinados que se pretendem ocultar quando utilizados como subordinados embora sendo ainda possível visualizá-los se se apresentar a popup como uma Popup principal
Aqui está um exemplo:
<table class="lizmap_merged">
 <tr class="lizmapPopupHeader">
     <th class="lizmapPopupHidden"><center> Idu </center></th>
     <th> <center> Type </center> </th>
     <th> <center> Surface</center> </th>
  </tr>
  <tr>
     <td class="lizmapPopupHidden"><center>[% "idu" %]</center></td>
     <td><center>[% "typezone" %]</center></td>
     <td><center>[% "surface" %]</center></td>
  </tr>
</table>
Criação de temas simples
Starting from Lizmap Web Client version 2.10, it is possible to create themes for all maps of a repository or for a single map. This function needs to be activated by the administrator and uses the directory media Media in Lizmap.
O princípio é:
the directory
mediacontains a directory namedthemesthe directory
themescontains a default directory for the theme of all the maps of the repositorythe directory
themesmay contain a directory per project, for the themes specific for each project
-- media
  |-- themes
    |-- default
    |-- map_project_file_name1
    |-- map_project_file_name2
    |-- etc
In order to simplify the creation of a theme for a repository or a map, Lizmap allows you to obtain the default theme fro the application, through the request: index.php/view/media/getDefaultTheme.
O pedido referido retorna um ficheiro zip contendo o tema padrão, com a seguinte estrutura:
-- lizmapWebClient_default_theme.zip
  |-- default
    |-- css
      |-- main.css
      |-- map.css
      |-- media.css
      |-- img
        |-- loading.gif
        |-- etc
      |-- images
        |-- sprite_20.png
        |-- etc
Uma vez descarregado o ficheiro zip, pode:
substitua as imagens
edite os ficheiros CSS
Aviso
Os ficheiros e os diretórios devem ter permissões de leitura (755:644)
To preview your results just add &theme=yourtheme at the end of your URL (e.g. https://demo.lizmap.3liz.com/index.php/view/map/?repository=montpellier&project=montpellier&theme=yourtheme).
A partir do momento em que o tema esteja pronto, pode publicá-lo, copiando-o para o diretório media.
Adicionar o seu próprio código JavaScript
Purpose
This is useful for a variety of advanced usage. For instance, you can avoid people being able to download elements of the page by right clicking on them, and of course much more.
Nota
This is available starting with Lizmap 2.11. For earlier versions, you must add your code directly to file lizmap/www/js/map.js.
In your repository (e.g.
/home/data/repo1/myproject.qgsyou should have these directories:media |-- js |-- myproject
All the Javascript code you copy in the
/home/data/rep1/media/js/myproject/directory will be executed by Lizmap, provided that:you allow it, through the Lizmap admin interface, adding the privilege «Allow themes for this repository» in the form for the modification of the repository
Eventos Javascript disponíveis
O código Javascript pode utilizar muitos eventos despoletados pelo Lizmap Web Client. Aqui está uma lista de todos os eventos disponíveis, com as propriedades retornadas.
Nome do evento |
Descrição |
Propriedades retornadas |
|---|---|---|
treecreated |
Acionado quando a árvore da camada foi criada no painel de legenda |
|
mapcreated |
Acionado quando o mapa OpenLayers foi criado |
|
layersadded |
Acionado quando as camadas Openlayers foram adicionadas |
|
uicreated |
Acionado quando a interface foi criada |
|
dockopened |
Acionado quando um painel é aberto (painel esquerdo) |
id |
dockclosed |
Acionado quando um painel é fechado (painel esquerdo) |
id |
minidockopened |
Acionado quando uma mini-painel (recipiente direito para ferramentas) é aberto |
id |
minidockclosed |
Acionado quando um mini-painel é fechado |
id |
bottomdockopened |
Acionado quando o painel inferior é aberto |
id |
bottomdockclosed |
Acionado quando o painel inferior é fechado |
id |
lizmapbaselayerchanged |
Acionado quando um tema base foi alterado |
camada |
lizmapswitcheritemselected |
Acionado quando uma camada foi destacada no painel de legenda de camadas |
name | type | selected |
layerstylechanged |
Acionado quando um estilo de camada foi alterado |
featureType |
lizmaplocatefeaturecanceled |
Acionado quando o utilizador cancelou a ferramenta localizar por camada |
featureType |
lizmaplocatefeaturechanged |
Acionado quando o utilizador selecionou um item na ferramenta localizar por camada |
featureType | featureId |
lizmappopupdisplayed |
Acionado quando o conteúdo popup é apresentado |
|
lizmappopupdisplayed_inattributetable |
Acionado quando o conteúdo popup é apresentado na tabela de atributos (sub-painel direito) |
|
lizmapeditionformdisplayed |
Acionado quando um formulário de edição é apresentado |
layerId | featureId | editionConfig |
lizmapeditionfeaturecreated |
Acionado quando um elemento de camada foi criado com a ferramenta de edição |
layerId |
lizmapeditionfeaturemodified |
Acionado quando um elemento de camada foi modificado com a ferramenta de edição |
layerId |
lizmapeditionfeaturedeleted |
Acionado quando um elemento de camada foi eliminado com a ferramenta de edição |
layerId | featureId |
attributeLayersReady |
Acionado quando todas as camadas a serem presentadas na ferramenta de listar registos foram definidas |
camadas |
attributeLayerContentReady |
Acionado quando uma tabela de uma camada foi apresentada no painel inferior da base |
featureType |
layerfeaturehighlighted |
Acionado quando um elemento foi destacado na tabela de atributos (retângulo cinza). Acionar este evento manualmente força uma atualização das tabelas relacionadas se houver alguma para a camada atual |
sourceTable | featureType | fid |
layerfeatureselected |
Acionar este evento para despoletar a seleção de um elemento numa camada, passando o ID do elemento. Após efetuada uma seleção, o evento layerSelectionChanged é acionado em retorno. |
featureType | fid | updateDrawing |
layerfeaturefilterselected |
Acionar este evento para despoletar a filtragem de uma camada para os elementos selecionados. Deve selecionar alguns elementos antes de acionar este evento. Uma vez aplicado o filtro, o Lizmap aciona o evento layerFilteredFeaturesChanged em retorno. |
featureType |
layerFilteredFeaturesChanged |
Acionado quando um filtro foi aplicado ao mapa para uma camada. Este evento também aciona o redesenhar do mapa e o conteúdo das tabelas de atributos. |
featureType | featureIds | updateDrawing |
layerFilterParamChanged |
Acionado quando os parâmetros de pedido do WMS foram alterados para uma camada. Por exemplo, quando um ESTILO ou um FILTRO foi modificado para a camada. |
featureType | filter | updateDrawing |
layerfeatureremovefilter |
Acionar este evento para remover qualquer filtro aplicado ao mapa. Uma vez executado, o evento layerFilteredFeaturesChanged é acionado de volta e o conteúdo do mapa e o conteúdo das tabelas de atributos são atualizados. |
featureType |
layerSelectionChanged |
Acionado quando a seleção foi alterada para uma camada. Isto também aciona o redesenhar do mapa e a atualização do conteúdo da tabela de atributos |
featureType | featureIds | updateDrawing |
layerfeatureselectsearched |
Acionar este evento para selecionar todos os elementos correspondentes às linhas apresentadas na tabela de atributos, que podem ser filtrados visualmente pelo utilizador, digitando alguns caracteres na entrada de texto de pesquisa. |
featureType | updateDrawing |
layerfeatureunselectall |
Acionar este evento para remover todos os elementos da seleção de uma camada. Uma vez executado, o Lizmap responde com o evento layerSelectionChanged |
featureType | updateDrawing |
lizmapexternalsearchitemselected |
Fired when the user has selected an item listed in the results of the header search input |
feature |
There are also some variables which are available.
Variable name |
Descrição |
|---|---|
lizUrls.media |
URL to get a media |
lizUrls.params.repository |
Name of the current repository |
lizUrls.params.project |
Name of the current project |
Exemplos
Here is a very small example allowing you to disable right clic in Lizmap. Just add a file named e.g. disableRightClick.js with the following code:
lizMap.events.on({
   uicreated: function(e) {
      $('body').attr('oncontextmenu', 'return false;');
   }
});
If you want this code to be executed for all projects of your repository, you have to copy the file in the directory
/home/data/rep1/media/js/default/rather than in/home/data/rep1/media/js/myproject/.
Here is a very useful example allowing you to send current login User-ID (and/or other user data) to PostgreSQL table column, using edition tool.
var formPrefix = 'jforms_view_edition';

// Name of the QGIS vector layer fields which must contain the user info
var userFields = {
   login: 'lizmap_user_login',
   firstname: 'lizmap_user_firstname',
   lastname: 'lizmap_user_lastname',
   organization: 'lizmap_user_organization'
};


lizMap.events.on({

   'lizmapeditionformdisplayed': function(e){

      // If user is logged in
      if( $('#info-user-login').length ){
            // Loop through the needed fields
            for( var f in userFields ){
               // If the user has some data for this property
               if( $('#info-user-' + f).text() ){
                  // If the field exists in the form
                  var fi = $('#' + formPrefix + '_' + userFields[f]);
                  if( fi.length ){
                        // Set val from lizmap user data
                        fi.val( $('#info-user-' + f).text() )
                        // Set disabled
                        fi.hide();
                  }
               }
            }
      }

   }

});
In the directory lizmap-web-client/lizmap/install/qgis/media/js/ you can find examples of suitable JavaScript code; just remove the extension .example and copy them to your media/js/default/ folder to activate them. You can also find some examples in the repository https://github.com/3liz/lizmap-javascript-scripts
If you want to get the URL of a static file.
var mediaUrl = OpenLayers.Util.urlAppend(
     lizUrls.media,
     OpenLayers.Util.getParameterString({
         "repository": lizUrls.params.repository,
         "project": lizUrls.params.project,
         "path": "picture.png"
     })
);
Printing configuration
To add print capabilities in the online map, you have to enbale the printing tool in the plugin Map tab (Configure the map) and the QGIS project has at least one print composition.
The print composition must contain at least one map.
you can add :
an image to North arrow
an image for the logo of your organization
a legend that will be fixed for all printing (before version 2.6)
a scale, preferably digital for display
a location map, a map for which you have enabled and configured the function of Overview
labels
You can allow the user to modify the contents of certain labels (title, description, comment, etc). To do this you need to add a identifier to your label in the composer. Lizmap will automatically ask you in the webbrowser to fill each fields. If your label is pre-populated in QGIS, the field will be pre-populated too in the webbrowser. If you check “Render as HTML” for your label in QGIS, you will have a multiline label in Lizmap.
Finally the print function will be based on the map scales that you set in the plugin Map (Configure the map).
Nota
It is possible to exclude printing compositions for the web. For example, if the QGIS project contains 4 compositions, the project administrator can exclude 2 compositions in the QGIS project properties, OWS server tab. So only the published compositions will be presented in Lizmap.
Permitir a impressão de temas base externos
The Lizmap plugin Baselayers tab allows you to select and add external baselayers (Configure the base layers). These external baselayers are not part of the QGIS project, default print function does not integrate them.
To overcome this lack Lizmap offers an easy way to print a group or layer instead of the external baselayer.
To add to printing a layer that replaces an external baselayer, simply add to the QGIS project a group or layer whose name is part of the following list:
osm-mapnik for OpenStreetMap
osm-mapquest for MapQuest OSM
osm-cyclemap for OSM CycleMap
google-satellite for Google Satellite
google-hybrid for Google Hybrid
google-terrain for Google Terrain
google-street for Google Streets
bing-road for Bing Road
bing-aerial for Bing Aerial
bing-hybrid for Bing Hybrid
ign-scan for IGN Scan
ign-plan for IGN Plan
ign-photo for IGN Photos
and then add your layer(s) you want to print as base.
Nota
A utilização deste método deve estar em conformidade com o licenciamento de temas base externos usados (Configure the base layers).
For OpenStreetMap baselayers, it is possible to use an XML file for GDAL to exploit the OpenStreetMap tile services. Its use is described in the GDAL documentation http://www.gdal.org/frmt_wms.html or in this blog post http://www.3liz.com/blog/rldhont/index.php?post/2012/07/17/OpenStreetMap-Tiles-in-QGIS (beware, EPSG code should be 3857).
By cons, if this layer has to replace an external baselayer, it must be accessible to QGIS-Server but should not be accessible to the user in Lizmap Web Client. So it must be hidden. See chapter Mascarar camadas individuais.
Optimizing Lizmap
Conceitos gerais
Rendering speed is crucial for a webGIS, much more so than for a desktop application:
os utilizadores web esperam ter tudo disponível quase imediatamente
each user can sends requests to the same application; if you have tens or hundreds of users, you can easy understand that optimising your web application is an important task.
You have to think to a web publication for many users rather than the display of a map to a single user.
By default, for each QGIS layer you add to your Lizmap project, you can choose from the Lizmap plugin whether to toggle the layer visibility on (checkbox Toggled?) at the startup of the application. You have to be careful not to abuse this feature, because if the project contains e.g. 30 layers, Lizmap at startup will send a request to QGIS server for each of them. If the checkbox Single Tile? is ticked, this will request 30 images of the size of your browser window. If not, Lizmap, through OpenLayers, will request 30 series of tiles (about 250 by 250 pixel). Each tile is an image, and is created as a function of the total window size and zooming level. Therefore, subsequent users will zoom in the same area, the tiles already generated will be reused. The tiles can be cached with two non exclusive systems:
server side, on the machine where QGIS server and Lizmap are installed. If the tile has been requested and generated earlier, and not expired, Lizmap will reuse it and send it to the client, avoiding a new request to QGIS server
client side: the tiles will be saved in the browser cache, and reused until they expire. This avoid both the request to QGIS server and the internet traffic.
The server cache has to be generated. In Lizmap <3, the only way of creating the tiles is to zoom and pan the whole map, and wait until all the tiles have been displayed. This is obviously impractical for projects covering a large area, with many zoom levels. in Lizmap >=3 we have developed a command line tool to generate all the tiles, or a selection of them.
Para otimizar o desempenho, é importante entender como o Lizmap usa os mosaicos para serem apresentados.
Let’s say you have a screen of 1280 by 768 pixels. If you have all your layers tiled, Lizmap has therefore to show about 5 by 3= 15 tiles (256 by 256 pixel each) per layer, and more for a larger screen, now common. If surrounding tiles are only partially shown, the total number will be even greater. An average of 20 tiles per layer is a reasonable estimate. With 30 layers, as in our example, this will mean a total of about 20 by 30= 600 tiles (therefore, 600 requests to Lizmap server) per user, at each startup of Lizmap and for every zoom & pan. If you have 10 concurrent users, this gets quite heavy for the server, if the cache has not been generated previously, and QGIS server has therefore to create them. The time required for each tile will depend heavily on the performance of the server and the complexity of the project.
O tamanho de cada mosaico dependerá de:
o tipo de dados (raster único ou vetor, ou combinação de várias camadas)
o formato de imagem escolhido (PNG, JPEG)
A typical tile could be around 30 Kb. In our example, the client will therefore download about 20 by 30= 600 Kb per layer, which, for 30 layers, will give a grand total of about 18 Mb, which is heavy both for the server (lots of connection bandwidth consumed) and for the users (long delay, even with a reasonably fast connection).
Estes cálculos mostram claramente que para alcançar bons desempenhos no mapeamento web é necessário fazer escolhas e simplificar o máximo possível.
Por exemplo, se alguém prestar atenção à abordagem do Google Maps ou serviços similares, é óbvio que, além de terem servidores poderosos, eles simplificaram ao máximo possível: apenas uma série de mosaicos como camada base e muito poucas camadas adicionais (e nem todas ao mesmo tempo). Mesmo que não seja possível criar um mapa tão simples, é importante, no entanto, saber quais camadas que devem ser mostradas na inicialização do mapa e quais os compromissos aceitáveis para os seus utilizadores.
Se o seu projeto tem 50 camadas passíveis de ligar e desligar, a grande maioria dos seus utilizadores nunca irá selecionar a maior parte delas. É claro que existem casos reais de uso em que as camadas individuais devem ser apresentadas seletivamente e, portanto, não é possível agrupá-las para reduzir o número de camadas mostradas.
Para otimizar o máximo possível a sua aplicação, sugerimos que:
Crie projetos QGIS separados e, consequentemente, mapas Lizmap diferentes para diferentes objetivos, agrupando os dados em temas lógicos. Por exemplo, um mapa sobre o desenvolvimento urbano com provavelmente 10 camadas e um sobre ambiente, com cerca de 5 camadas, geralmente são mais legíveis, e muito mais rápido, do que um único projeto complexo com todos os dados. Adicionar uma pequena imagem para cada projeto ajudará os utilizadores a selecionar o projeto mais relevante à primeira vista. Também é possível partilhar algumas das camadas entre os diferentes projetos, através do mecanismo de incorporação do QGIS.
Use the option Maps only in the administrator web interface. This option allows the user to switch automatically from one map to another, through the button Home, maintaining as much as possible the localization and the zooming level. In this case, the Lizmap welcome page with the list of projects and their thumbnails is not displayed, and the user is directed automatically to one of the projects, at the administrator choice.
Do not show all the layers at startup (deactivate the checkbox Toggled? as described above). Only very important layers should be visible by default, and users should activate only the layer they need. This allow a sensible reduction in the number of requests, and of the total network traffic.
Create groups of layers, and use the option Group as layer? in Lizmap plugin. Generally a series of layers of the same general theme can be displayed as a whole, with an appropriate choice of styles. In this case, Lizmap will only show one checkbox for the whole group, and more importantly it will request only one series of tiles for the whole group, thus reducing the number of tiles and server requests, and the total volume of data to be downloaded. The legend of the group will be displayed.
Use the option Single Tile? for some layers. In this case, Lizmap will request only one image per layer, of about the size of the screen, instead of a series of tiles. This will therefore greatly reduce the number of requests to the server. For instance, in our example above, without the optimizations described, if all the layers are displayed, every user will request 30 images (one per layer) for every zoom or pan, instead of 480. The total size of data to be downloaded is however similar. On the other hand, different users will be very unlikely to request exactly the same image, therefore using a cache is pointless in this case, and is avoided by Lizmap (the two options are mutually exclusive). The optimal choice (single tile vs. tiled) is different for different layers. For instance, a complex base layer, created by combining 15 individual layers, will be best used as a group (Group as layer?), tiled and cached. A simple linear layer, like a series of bus lines, can be displayed as a single tile.
Use the option Hide checkboxes for groups: this avoids the users to click on a group with e.g. 20 layers without really needing it, thus firing a big series of requests to the server. In any case, avoiding groups of more than 5-10 layers is usually good practice.
Otimize os dados e o projeto QGIS. Como mencionado acima, a publicação de um mapa na Internet vai mudar o seu ponto de vista: como já referido, é necessário ter em atenção que muitos utilizares podem fazer solicitações ao servidor em paralelo, dessa forma evitar a sobrecarga é crucial para:
criar um índice espacial para todas as suas camadas vetoriais
criar pirâmides para todas as suas camadas raster (exceto para as muito pequenas)
apresentar apenas dados na escala apropriada: por exemplo, apresentar uma camada detalhada de construções a 1:500.000 não faz sentido, pois a imagem é praticamente ilegível e exige demasiado esforço do servidor
use simplified version of a layer to display it at different scales. You can then group the original layer (to be displayed e.g. around 1:1,000) with the simplified versions (to be displayed e.g. around 1:10,000, 1:50,000, etc.), and Goup as a layer to let the user see this as a single layer, using the most appropriate data at each scale
Tenha cuidado com a reprojeção On The Fly (OTF). Se, por exemplo, apresentar dados em Lambert 93 (EPSG:2154) sobre um mapa base do OpenStreetmap ou Google (em Pseudo Mercator, EPSG:3857), o QGIS Server necessitará de reprojetar rasters e vetores antes de gerar o mapa. Isso pode ter um impacto nos tempos de renderização para camadas grandes e complexas. Em França, pode evitar a reprojeção utilizando o mapa de base IGN Géoportail diretamente em EPSG:2154
esteja ciente do fato de que certas opções de renderização (p.ex., rótulos, expressões, etc.) podem ser muito exigentes relativamente ao servidor
se utilizar o PostGIS, otimize-o: adicione sempre índices espaciais, índices para campos filtrados, para chaves estrangeiras, parâmetros apropriados para a configuração do PostgreSQL, possivelmente uma ligação via socket Unix em vez de TCP/IP (pode fazer isso através da utilização de serviços), etc.
use an appropriate image format. For the base layers, where you do not need transparency JPEG is usually the best option: the tiles will be smaller, and faster to download. For other layers, try smaller depth PNGs (16bit or 8bit): for some symbolizations, the visual result may be the same, and the tiles smaller. Have a check to see if the image quality is acceptable in your case
Atualize seu servidor. Esta é sempre uma opção, mas muitas vezes inútil se não otimizar o seu projeto como descrito acima. Em qualquer caso, um servidor de gama baixa (por exemplo, 2 Gb de RAM, 2 núcleos a 2,2 GHz) é inadequado. Um quad-core rápido com 8 Gb de RAM é o mínimo razoável. Evite instalar o servidor QGIS e o Lizmap em Windows, é mais complexo e mais lento.
Nota
In Lizmap 3 you’ll find several improvements that will help optimizing your installation:: * a tool for the preparation of the server cache, through the use of a WMTS protocol. In addition, this will allow to use the cached layers as WMTS layers in QGIS desktop * avoiding the automatic download of the legends at startup, and at every zoom level; this will be done exclusively on demand, if the legend is displayed, thus saving one request per layer for each zoom * code optimization.
Em detalhe: como ativar as caches
The Lizmap plugin Layers tab allows you to enable for each layer or group as a layer the cache for generated images. This feature is not compatible with the option not tiled image.
Activating the cache server side
Lizmap Web Client can dynamically create a cache tiles on the server. This cache is the storage of the images already generated by QGIS-Server on the server. The Lizmap Web Client application automatically generates the cache as the tiles are requested. Enable caching can greatly lighten the load on the server, since we do not want more QGIS-Server tiles that have already been made.
To activate it you must:
check the box Server cache?
specify the expiration time of the cache server in seconds: Expiration (seconds)
The Metatile option allows you to specify image size in addition for generating a tile. The principle of Metatile is to request the server for a bigger image than hoped, to cut it to the size of the request and return it to the Web client. This method avoids truncated labels at the edges and discontinuities between tiles, but is more resource intensive. The default value is 5,5, an image whose width and height are equal to 5 times the width and height request. This option is useless for rasters.
Activating the cache client side
The Browser client cache option allows you to specify an expiration time for the tiles in the Web browser (Mozilla Firefox, Chrome, Internet Explorer, Opera, etc.) cache in seconds. When browsing the Lizmap map with the browser, it stores displayed tiles in its cache. Enable client cache can greatly optimize Lizmap because the browser does not re-request the server for tiles already in cache that are not expired. Values 0,0 and 1,1 are equivalent, and do not activate the option.
Sugerimos que defina o valor máximo (1 mês, equivalente a 24 x 3600 x 30 = 2,592,000 segundos), exceto, obviamente, para camadas cujos dados mudam frequentemente.
Nota
A cache deve ser ativada apenas em renderização real, quando desejar colocar o projeto em produção.
The 2 cache modes, Server and Client, are completely independent of one another. But of course, it is interesting to use the two together to optimize the application and free server resources.
Centralizar a cache com a integração de grupos e camadas de um projeto principal
In QGIS, it is possible to integrate in a project, groups or layers from another project (which will be called «parent»). This technique is interesting because it allows you to set the properties of the layers once in a project and use them in several other, for example for baselayers (In the «son» projects that integrate these layers, it is not possible to change the properties).
Lizmap uses this feature to centralize the tiles cache. For all son projects using integrated layers of the parent project, Lizmap requests QGIS-Server tiles from the parent project, not form son projects. The cache will be centralized at the parent project, and all son projects that use layers benefit shared cache.
Para utilizar este recurso, deve:
publicar o projeto QGIS pai com o Lizmap
you must choose the right announced extent in the OWS Server tab from project properties, because this extent will be reused identically in son projects.
you must configure the cache for the layers to integrate. Also, note the options chosen here (image format, metatile, expiration) for use as such in the son projects.
It is possible to hide the project from the main page of Lizmap with the check box Hide the project Web Client Lizmap in the plugin “Map” tab.
open the son project, and integrate layers or groups in this project, for example orthophoto. Then you must:
verify that the announced extent in the QGIS project properties / OWS Server is exactely the same as the parent project.
configurar a cache para a camada integrada com exatamente as mesmas opções que as selecionadas a partir do projeto pai: tamanho da imagem, expiração, mosaico grande.
definir o id Lizmap do repositório de origem do projeto pai (de acordo com o configurado na interface de administração do Lizmap Web Client).
the code of the «Source project» (the name of the parent QGIS project without the .qgs extension) is automatically entered for layers and integrated groups.
Publish the son project to the Lizmap Web Client as usual.
Mascarar camadas individuais
You can exclude layers of your publication with the OWS Server tab of the QGIS project properties. In this case the layers will not be available in Lizmap. With this method, you cannot use a layer in the locate by layer function and not display in the map.
To overcome this lack Lizmap offers a simple way to not display some layers.
Not to display one or more layers of QGIS project in the legend of the Web map, just put these layers in a group called «hidden». All the layers in this group will not be visible in the Web application.
Este recurso pode ser utilizado para:
ocultar uma camada utilizada na localização por camada (Add the localization function)
ocultar uma camada simples para adicionar dados renderizados através duma view
ocultar uma camada para impressão (Permitir a impressão de temas base externos)
Show attribute table for Lizmap layers
Princípio
Lizmap is designed to show spatial data in the main map, and you can propose users to see an object data through the «popup» feature (a small popup containing the objects data is shown whenever the user clicks on the map ). See How to configure popups
Sometimes this is not enough, and as a map editor, you would like the user to see all the data of a specific layer, as you can do in QGIS by opening the attribute table. Since Lizmap 2.11, you can propose such a feature for any vector layer published in you map. (This feature has been heavily enhanced since Lizmap 3.0. Many features described underneath are only available for Lizmap 3.0 )
Activate the attribute table tool for a vector layer
No separador Ferramentas do diálogo do plugin do Lizmap, há um grupo chamado «Tabela de atributos» que mostra uma tabela e alguns campos de formulário dedicados para adicionar ou remover camadas vetoriais.
Lizmap Web Client uses the Web Feature Service (WFS) to get data from a QGIS vector layer and display it in the web interface. This is why the first thing to do whenever you want to show a layer data in the web client is to publish the vector layer through the WFS. To do so, open the Project properties dialog, got the the OWS Server tab, and add the layer as «published» by checking the corresponding checkbox in the Web Feature Service table, and save the project. You can also tune the number of decimals to decrease the size of data to be fetched from WFS ( keep 8 only for a map published in degrees, and keep 1 for map projections in meters )
Once the layer is published through WFS, you can add it in the attribute layers table. Some options are available to finely tune the features provided to the user:
Camada: Escolha uma das camadas vetoriais (espaciais ou não). Pode ser qualquer formato de camada vetorial: GeoJSON, Shapefile, PostGIS, CSV, etc.
ID único: A ferramenta de tabela de atributos tem de conseguir definir cada elemento como único. Recomendamos vivamente que adicione esse campo se a sua camada ainda não tiver nenhum. Geralmente, o campo ID único contém inteiros. Se a camada não tiver esse tipo de campo, pode criá-lo facilmente com a Calculadora de campo. Escolha o tipo de campo correto a partir da caixa de combinação.
Campos a ocultar Existem 2 formas de ocultar campos na tabela de atributos publicada.
Na caixa de diálogo propriedades da camada vetorial da camada vetorial QGIS, no separador Campos, pode desmarcar a caixa de verificação na coluna WFS para os campos que não deverão ser publicados. Isto significa que estes campos não serão publicados através do protocolo WFS. Esta é a maneira mais simples e mais segura de restringir a publicação de alguns campos (por exemplo, para ocultar campos sensíveis)
Pode utilizar a opção Campos a ocultar para ocultar os campos de dados na apresentação da tabela de atributos. Os campos ocultos não serão visíveis para o utilizador final, mas ainda estarão disponíveis para o Lizmap Web Client. Deve utilizar esta opção para ocultar o campo ID único. Se utilizar a primeira forma (desmarcando a coluna WFS), o ID exclusivo não será utilizável pelo Lizmap e alguns dos recursos da tabela de atributos não funcionarão corretamente.
Using relations with the attribute layers tool
No QGIS, pode configurar relações entre camadas, na caixa de diálogo Propriedades do projeto. Se publicar no Lizmap mais de uma camada na ferramenta de atributos das camadas e se algumas camadas fizerem parte de uma relação, o utilizador final poderá ver tabelas subordinadas na tabela de atributos de camadas mãe. Um clique numa das linhas da tabela mãe irá despoletar o filtro de conteúdo na tabela filha.
Por exemplo, poderia ter uma camada respeitante a cidades, e uma camada filha de edifícios públicos. Clicando numa cidade na tabela de atributos fará com que a tabela filha de edifícios públicos atualize seu conteúdo apenas com os edifícios públicos correspondentes à cidade selecionada.
Pode usar as relações «muito-para-muito» (N:M) no QGIS desde a versão 2.14 mas o Lizmap ainda não as usa automaticamente. Tem também de definir as relações no plugin Lizmap. Em muitos casos, as relações N:M são muito úteis. Por exemplo, pode ter as seguintes três camadas vetoriais no seu projeto:
Linhas de elétrico: este nome de camadas «Linhas» contém um elemento por linha de elétrico, e tem um campo ID único tram_id
Paragens do elétrico: esta camada chamada «Paragens» contém um elemento por paragens de elétrico, com um campo ID único chamado stop_id
Tabela de correspondência entre Linhas e Paragens: esta camada chamada «Pivot» é uma tabela dinâmica entre linhas de elétrico e paragens, uma vez que uma paragem pode ser utilizada por mais de uma linha e uma linha serve muitas paragens. Os campos são os seguintes : tram_id, stop_id e order que define a ordem de paragem na linha.
Pode adicionar 2 relações nas propriedades do projeto QGIS: uma entre Linhas e Pivot utilizando o campo tram_id e outra entre Paragens e Pivot utilizando o campo stop_id.
No Lizmap, adicionámos uma forma simples de configurar a relação de N:M. Pode simplesmente
Crie as duas relações tal como descritas acima na caixa de diálogo de propriedades do projeto QGIS, separador Relações
Adicione as camadas Linhas e Paragens na ferramenta de atributos das camadas
Adicione a camada Pivot na ferramenta de atributos das camadas com a opção Tabela dinâmica marcada
O Lizmap Web Client irá então tratar a relação como uma relação de N:M:
A tabela dinâmica será apresentada para cada tabela de atributos mãe e mostrará apenas as filhas correspondentes.
O recurso de filtro baseado nas camadas de atributos ativará o filtro em cascata relativo à tabela dinâmica e à outra tabela mãe. Por exemplo, se o utilizador usar o filtro para mostrar apenas uma linha de elétrico, o Lizmap também mostrará apenas as paragens correspondentes no mapa e na tabela de atributos Paragens
Attribute table and edition
todo
Editing data in Lizmap
Princípio
Since version 2.8, it is possible to allow users to edit spatial and attribute data from the Lizmap Web Client interface for PostgreSQL or Spatialite layers of the QGIS project. The Lizmap plugin allows you to add one or more layers and choose what actions for each will be possible in the web interface:
criar elementos
modificar atributos
modificar a geometria
apagar elementos
O formulário Web apresentado ao utilizador para preencher a tabela de atributos suporta as ferramentas de edição disponíveis no separador campos das propriedades da camada vetorial do QGIS. Pode configurar uma lista de valores, ocultar uma coluna, torná-la não editável, utilizar uma caixa de verificação, uma área de texto, etc. Toda configuração é feita com o rato, tanto no QGIS como no plugin Lizmap.
Além disso, o Lizmap Web Client deteta automaticamente o tipo de coluna (integer, real, string, etc.) e adiciona as verificações e os controlos necessários nos campos.
Usage examples
Uma cidade deseja que os cidadãos identifiquem problemas visíveis na estrada: lixo não recolhido, iluminação danificada, destroços a serem removidos. O administrador do projeto QGIS cria uma camada dedicada a recolher dados e a apresentá-los para todos.
Um gabinete de engenharia quer permitir que os parceiros do projeto tracem observações sobre as áreas do mesmo. É possível a adição de polígonos numa camada apropriada.
Configuring the edition tool
Para permitir a edição de dados no Lizmap Web Client, deve:
At least one vector layer with PostGIS or Spatialite type in the QGIS project.
Configure editing tools for this layer in the fields tab of the layer properties. This is not required but recommended to control the data entered by users.
Add the layer in the tool with the plugin
Aqui estão os passos detalhados:
Se necessário, crie uma camada na sua base de dados com o tipo de geometria desejado (ponto, linha, polígono, etc.)
pense em adicionar uma chave primária: isso é essencial!
A coluna da chave primária deve ser do tipo incremento automático. Por exemplo serial para PostgreSQL.
pense em adicionar um índice espacial: isso é importante para o desempenho
*crie campos estritamente necessários para atributos *: se possível, use nomes de campo simples!
Please refer to the QGIS documentation to see how to create a spatial layer in a PostGIS or Spatialite database: http://docs.qgis.org/html/en/docs/user_manual/index.html
Set the editing tools for your layer fields
Open the layer properties by double-clicking on the layer name in the legend.
Go to Fields tab.
Select the Editing tool in the Edit widget column for each field of the layer:
To hide a field, choose Hidden. The user will not see the field in the form. There will be no content inserting. Use it for the primary key.
To add a read-only field, unchecked Editable checkbox.
Special case of the option Value Relation. You can use this option for a Lizmap map. For users to have access to information of the outer layer that contains the data, you must enable the publication of the layer as a WFS layer in the OWS Server tab of the QGIS project properties.
etc.
QGIS 2 evolutions:
To hide columns in the Lizmap popup, you must now uncheck the box in the WMS for each field to hide (this column is just after Alias)
Lizmap Web Client does not know the «QT Designer UI file» for form generation. Therefore only use the Autogenerate mode or Drag and drop mode for editing layers.
Nota
All the editing tools are not yet managed by Lizmap Web Client. Only the following tools are supported: Text edit, Classification, Range, Value Map, Hidden, Check Box, Date/Time, Value Relation, Relation Reference. If the tool is not supported, the web form displays a text input field.
Nota
To make the field compulsory you have to define it as NOT NULL in the properties of the table, at the database level.
Nota
É necessário ter algum cuidado caso a camada contenha valores do tipo Z ou M, infelizmente o Lizmap irá definir os mesmos como «0», utilizando assim o valor padrão para os gravar na base de dados.
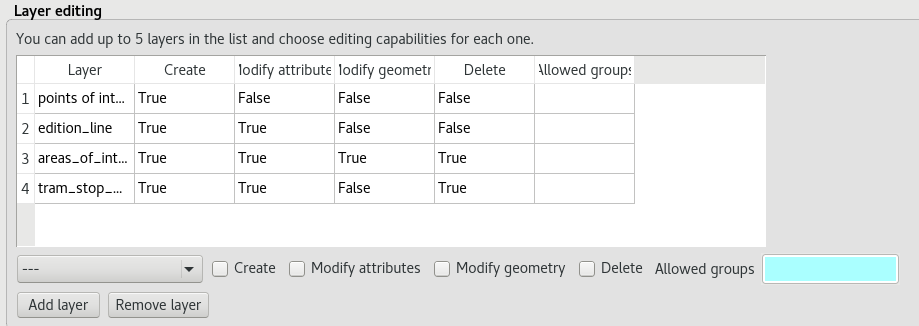
Add the layer in the table «Layer Editing» located in the plugin Lizmap «Tools» tab:
Selecione a camada na lista de valores
Marque as ações que pretende ativar:
Create
Modify attributes
Modify geometry
Delete
Add the layer in the list with the «Add layer» button.
Reutilização de dados das camadas para edição
As camadas selecionadas para a ferramenta de edição são «camadas como as outras», o que significa que:
Os estilos e etiquetas QGIS são aplicados a essas camadas. Pode criar estilos e etiquetas que dependam de um valor de uma coluna da camada.
Se pretender disponibilizar a ferramenta de edição, mas não permitir que os utilizadores visualizem os dados da camada on-line (e, portanto, as adições de outros utilizadores): pode simplesmente ocultar camadas de edição colocando-as num diretório oculto. Veja Mascarar camadas individuais
As camadas são imprimíveis se não estiverem mascaradas.
Os dados são armazenados numa camada do projeto. O administrador pode recuperar esses dados e utilizá-los posteriormente.
Nota
PostGIS ou Spatialite? Para centralizar od daos, recomendamos utilizar uma base de dados PostGIS para armazenamento. Para as camadas Spatialite, tenha cuidado para não substituir o arquivo Spatialite armazenado no diretório Lizmap do servidor com o que existe localmente: não se esqueça de fazer um backup do arquivo do servidor antes de uma nova sincronização com o diretório local.
Nota
Utilizando a cache: para utilizar a cache do servidor ou do cliente em camadas para edição, faça-o conscientemente: os dados não serão visíveis para os utilizadores até que a cache não tenha expirado. Sugerimos não ativar a cache em camadas para edição.
Nota
Lizmap 3 only
Adicionar ficheiros e imagens a elementos
Use the media/upload folder relative to the project
With Lizmap 3, it is now possible to upload your files, including images, for each feature, during online editing; to achieve this, you need to:
Configure edition for the layer, with one or more fields with the edit type «Photo» or «File». For example, let say the field name is «photo»
Create a folder at the root of the QGIS project file : media/ and a subfolder media/upload (obviously you need to do that locally in your computer and server side ).
Give webserver user (usually www-data) write permission on the upload folder, so that it can create files and folders in media/upload:
chmod 775 -R media/upload && chown :www-data -R media/upload
Check you
php.inito see if the variablespost_max_sizeandupload_max_filesizeare correctly set (by default, php only allows uploading files up to 2 Mbyte)
Lizmap will then create folders to store the data, depending on the layer name, field name, etc. For example, a file would be stored in the folder media/upload/PROJECT_NAME/LAYER_NAME/FIELD_NAME/FILE_NAME.EXT and an image in media/upload/environment/observations/species_picture/my_picture.png.
Obviamente, o Lizmap conseguirá apresentar esta imagem (ou qualquer outro ficheiro) na popup, tal como o mesmo foi armazenado na pasta de media. Veja Utilização de popups
Use a specific destination folder
Since Lizmap 3.2, you can override the default destination folder media/upload/PROJECT_NAME/LAYER_NAME/FIELD_NAME/FILE_NAME.EXT by manually setting the path where to store the media, relatively to the project. To do so, you must use the External resource field edit widget, and configure it with:
a Default path written relative to the project. For example
../media/images/if you want to store this field files in a folder media situated alongside the project folder. You can also choose set a path inside the project media folder. For examplemedia/my_target_folder/.chek the Relative path checkbox, with the default Relative to project path option
if the field should store a image, you should also check the Integrated document viewer checkbox, with the type Image
This allow to store the sent media files and images in a centralized folder, for example a directory media at the same level than the Lizmap repositories folders:
media
images <– to store images in this folder, use:
../media/images/pdf
environment
trees.qgs
trees.qgs.cfg
media
tree_pictures/ <– to store images in this folder, use:
media/tree_pictures/
Filtered layers - Filtering data in function of users
Presentation of the function
Normalmente, a gestão dos direitos de acesso aos projectos Lizmap é feita através do diretório. Neste caso, a configuração é feita através da interface de administração do Lizmap Web Client. Veja Definir as permissões de cada grupo. Isso ocultará completamente alguns projetos com base nos grupos de utilizadores, mas requer um diretório e gestão de projetos.
Em vez disso, o recurso de filtragem aqui apresentado permite que publique um único projeto QGIS e filtre os dados apresentados no mapa com base no utilizador ligado ao sistema. É possível filtrar apenas camadas vetoriais porque o Lizmap utiliza, para o efeito, uma coluna da tabela de atributos.
Atualmente, o processo de filtragem utiliza o ID do grupo de utilizadores ligado à aplicação Web. O mesmo estará ativo para todas as solicitações feitas ao servidor QGIS e, portanto, diz respeito a:
as imagens de camadas vetoriais apresentadas no mapa
the popups
as listas de recursos Localizar por Camada. Veja Add the localization function
drop-down lists of Editing forms from Value relation. See Editing data in Lizmap
próximos recursos (apresentação da tabela de atributos, recursos de pesquisa, etc.)
Está disponível um vídeo tutorial em: https://vimeo.com/83966790
Configuration of the data filter tool
Para utilizar a ferramenta de filtragem de dados no Lizmap Web Client, deve:
use QGIS 2 and above on the server
ter acesso à interface de administração do Lizmap Web Client
Aqui estão os passos detalhados para configurar este recurso:
Knowing the identifiers of user groups configured in the Lizmap Web Client adminstration interface. For this, you must go to the administration interface : ID appears in parentheses after the name of each group (under the title Groups of new users)
- For all vector layers which is desired filter data, just add a text column that will hold the group ID for each line (not the name !!) who has the right to display this line.
Fill this column for each line of the attribute table with the identifier of the group who has the right to see the line (using the calculator, for example).
It is possible to set all as the value in some lines to disable the filter: All users will see the data from these lines.
Se o valor nesta coluna para uma linha não corresponder a um grupo de utilizadores, os dados não serão apresentados para nenhum dos utilizadores.
Add the layer in the table Filter Data by User located in the plugin Lizmap Tools tab:
Select layer from the dropdown list
Select the field that contains the group identifier for the layer
Add the layer in the list with the button Add layer
To remove a layer of the table, click on it and click the button Delete the layer
Disable the client cache and cache server for all filtered layers. Otherwise, the data displayed will not be updated between each connection or user logout!
Time Manager - Animation of temporal vector layers
You can create animations of your vectors, provided you have at least a layer with a column with a valid date/time. You should select from the plugin:
at least one layer with the date/time
the column with the date/time
the number and type of time units for each step of the animation
the duration, in milliseconds, of each step (the default is to display each 10 days block for one second)
one field to display as a label when hovering with the mouse over the objects
optionally, an ID and a title for groups of objects.
When ready, your web application will display the symbol of a watch; clicking on it will open a small panel that will allow you to move between steps, or paly the entire animation. At startup, the application will load the entire table, so if you have thousands of objects you may need to wait for several seconds before the application is available.
Um tutorial em vídeo está disponível em: https://vimeo.com/83845949. O mesmo mostra todas as etapas necessárias para utilizar a funcionalidade.
Demonstration site: http://demo.lizmap.3liz.com/index.php/view/?repository=rep6
Nota
Several different formats for date/time are acceptable (those supported by the JavaScript library DateJS). You can check whether your format is supported by entering it in this page: http://www.datejs.com/
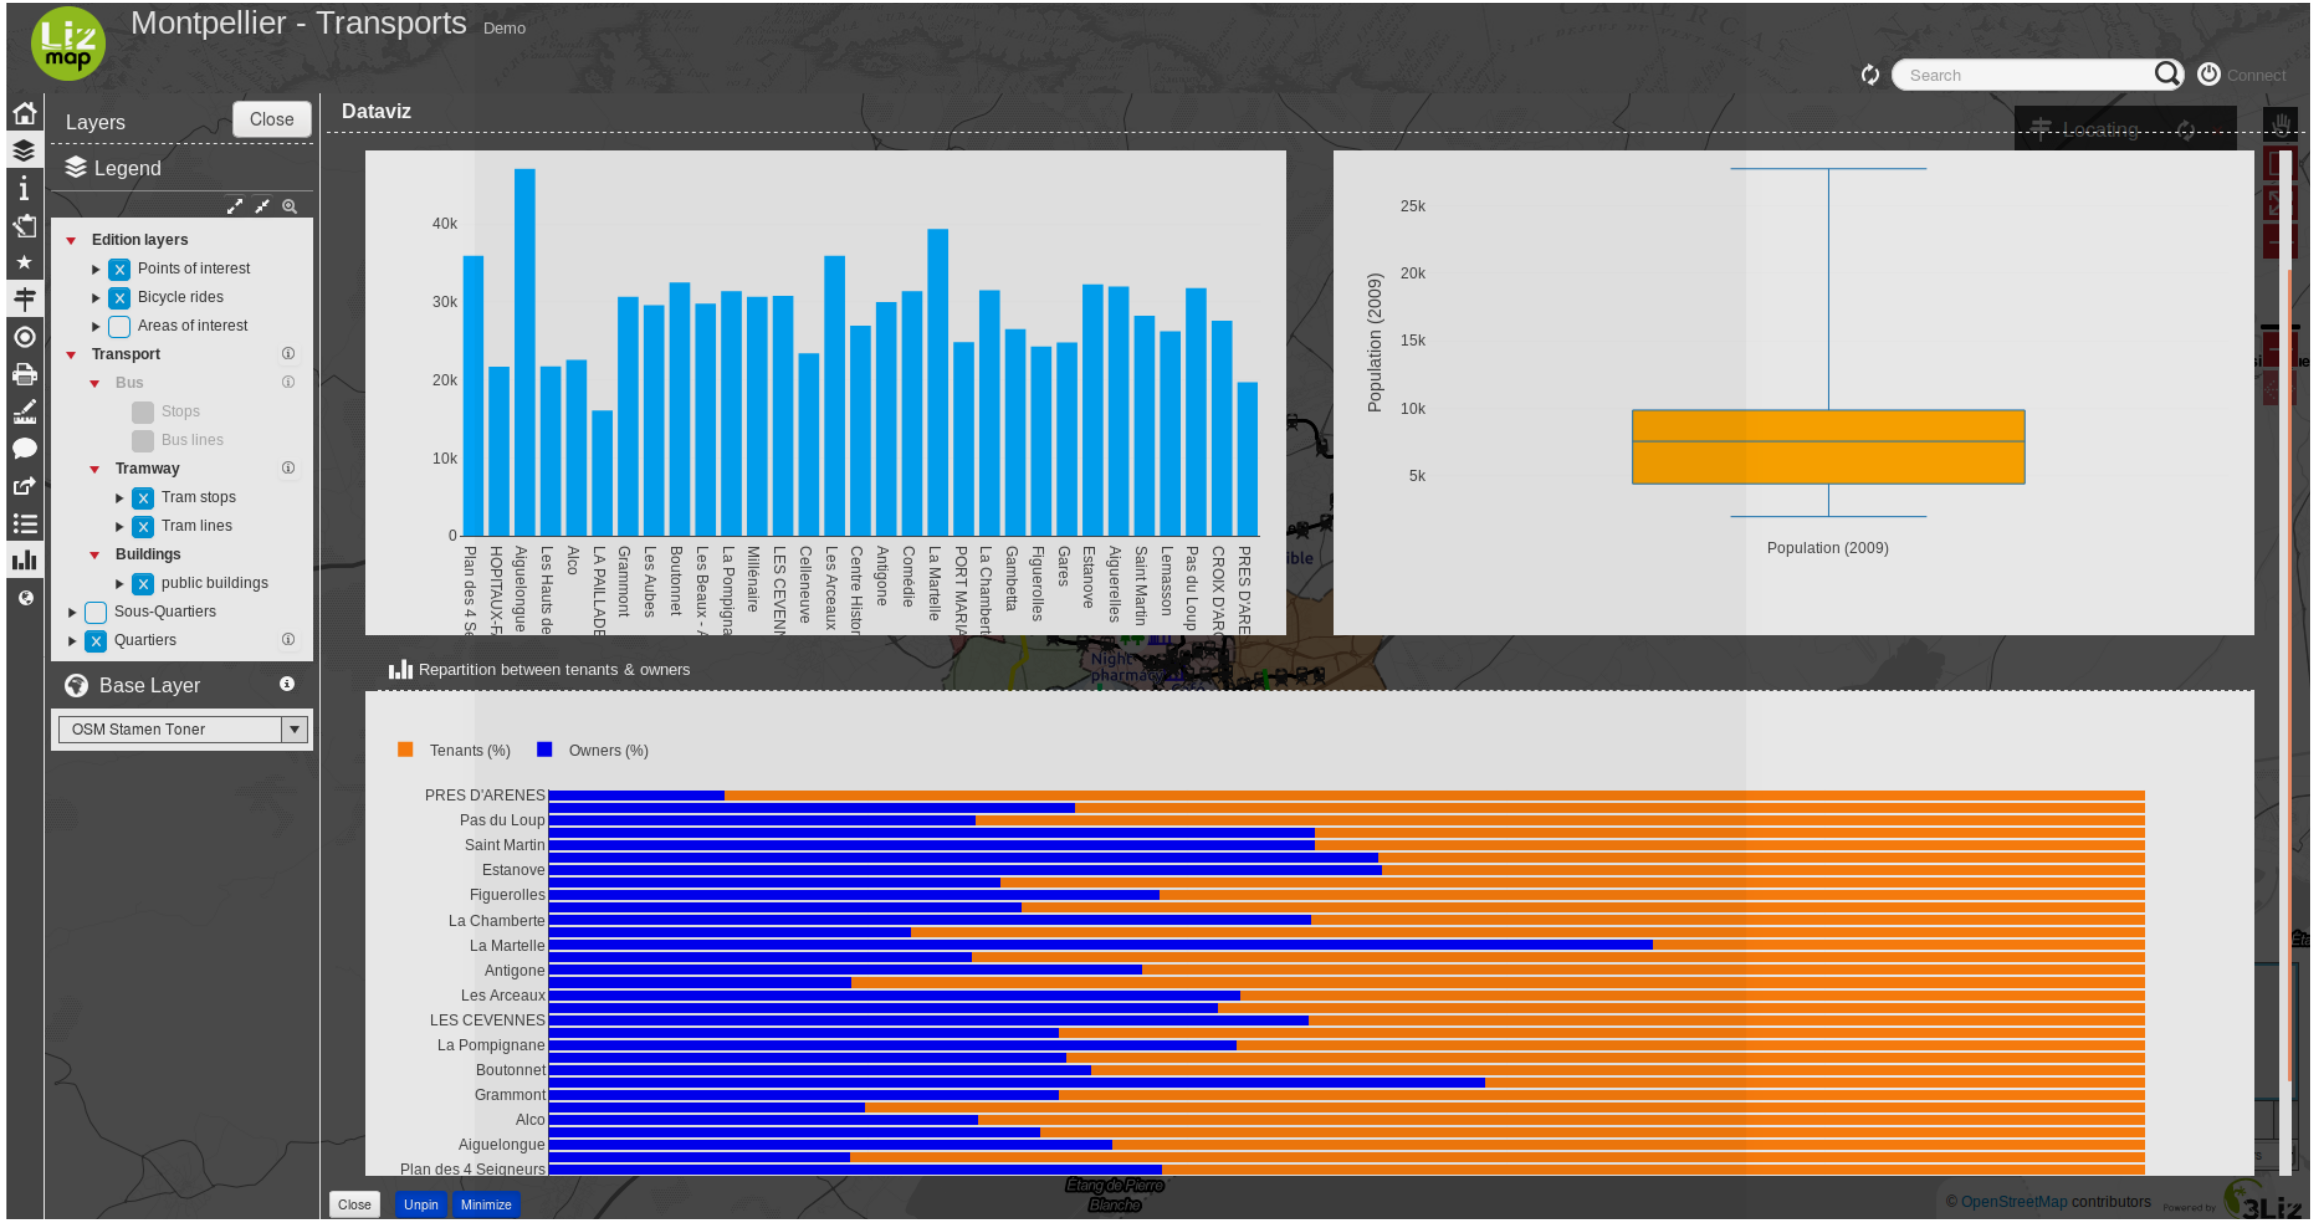
Statictics with Dataviz
In the 3.2 version of Lizmap, a way to show charts in Lizmap is implemented. You will be able to create a few kinds of graph (scatter, pie, histogram, box, bar histogram2d, polar) with only a few clicks.
You can easily configure it with the plugin Lizmap in Qgis in the Dataviz panel.
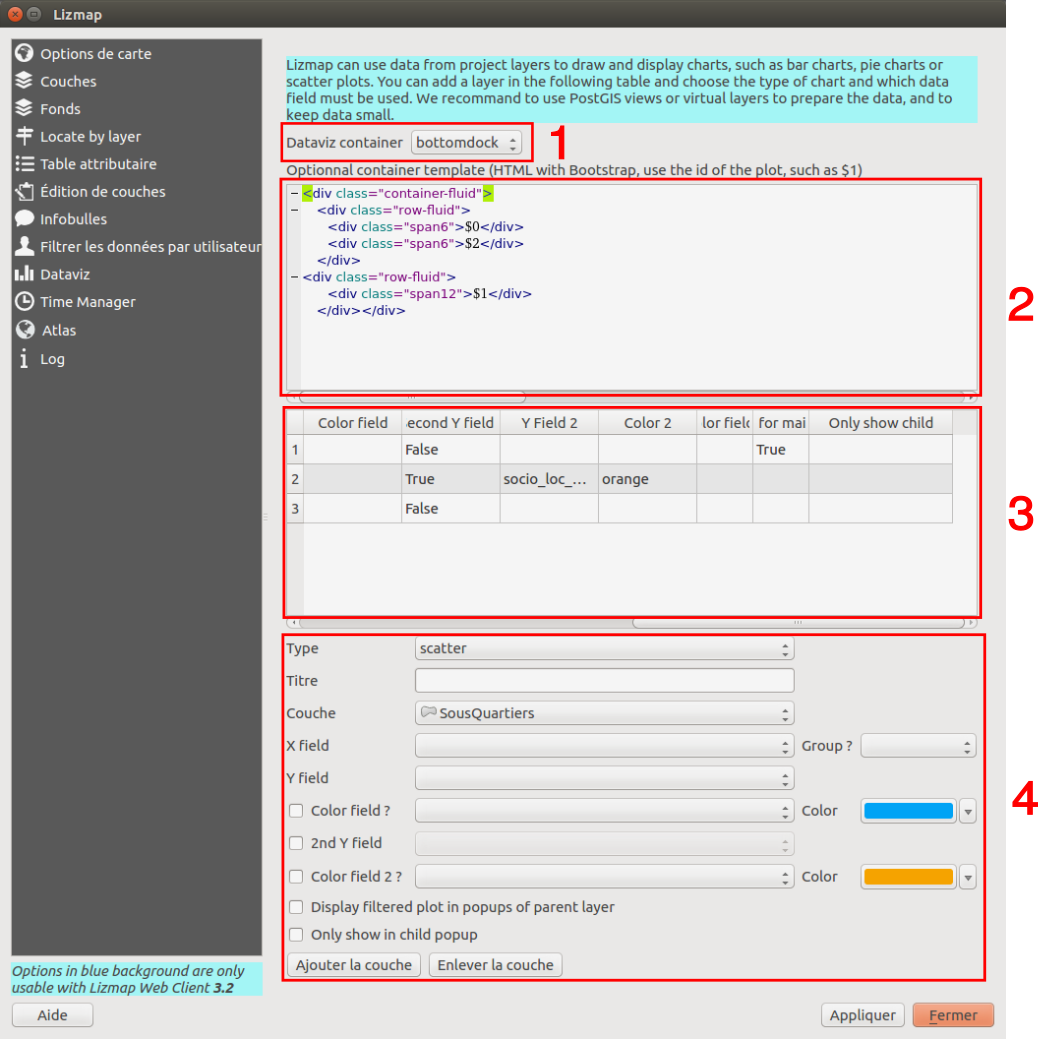
1 : You have the possibility to change the value to dock, bottomdock or right-dock these options change where your dataviz panel will be located in your Lizmap’s project. You have 3 positions available, at the right of the screen, bottom and right.
2: Here, you have the possibility to write in HTML to change the style of the container of your charts. If you are proficient in the HTML language, there are a lot of possibilities and you can customize your container the way you want.
3: This table contains all the layers you have configured to be able to show statistics in your Lizmap project. All details about the configuration are shown in this table. You have to use it if you want to remove a layer, you will need to click on a line of the table then click on the button remove a layer at the bottom on the panel.
4: To add a graph, you have to configure it in this part of the panel.
Type : You can choose the type of your graph, the available options are - scatter, box, bar, histogram, histogram2d, pie and polar.
Title : Here you can write the title you want for your graph.
Layer : You chose which layer you want to make a graph with.
X field : The X field of your graph.
Y field : The Y field of your graph.
Group? : For a few types of charts like “bar” or “pie”, you can chose to aggregate the data in the graph. There are a few aggregate functions available - average(avg), sum, count, median, stddev, min, max, first, last
Color field : you can choose or not a color field to customize the color of each category of your chart. If you want to do it, you need to check the checkbox, then chose the field of your layer which contains the colors you want to use. The color can be written like “red” or “blue” but it can be an HTML color code like “#01DFD7” for example.
2nd Y field : You can add a second Y field, it does not work for every type of graph, it’s only working for histogram2d.
Color field 2 ? : You can chose the color of the second Y field the same way you chose the one for his first Y field.
Display filtered plot in popups of parent layer : if you check this checkbox, the children of your layer will get the same graph as the parent plot but filtered only for them. It’s useful if you want to see the statistics of one entity instead of all.
Only show child : The main graph will not be shown in the main container and only the filtered graph of the relation of the layer will be displayed in the popup when you select the element.
When all the configuration is done, you have to click on the button add a layer at the bottom of the window.
Atlas - sequence of entities of a chosen layer
This feature let you chose and configure a layer to make her into an atlas in your Lizmap project.
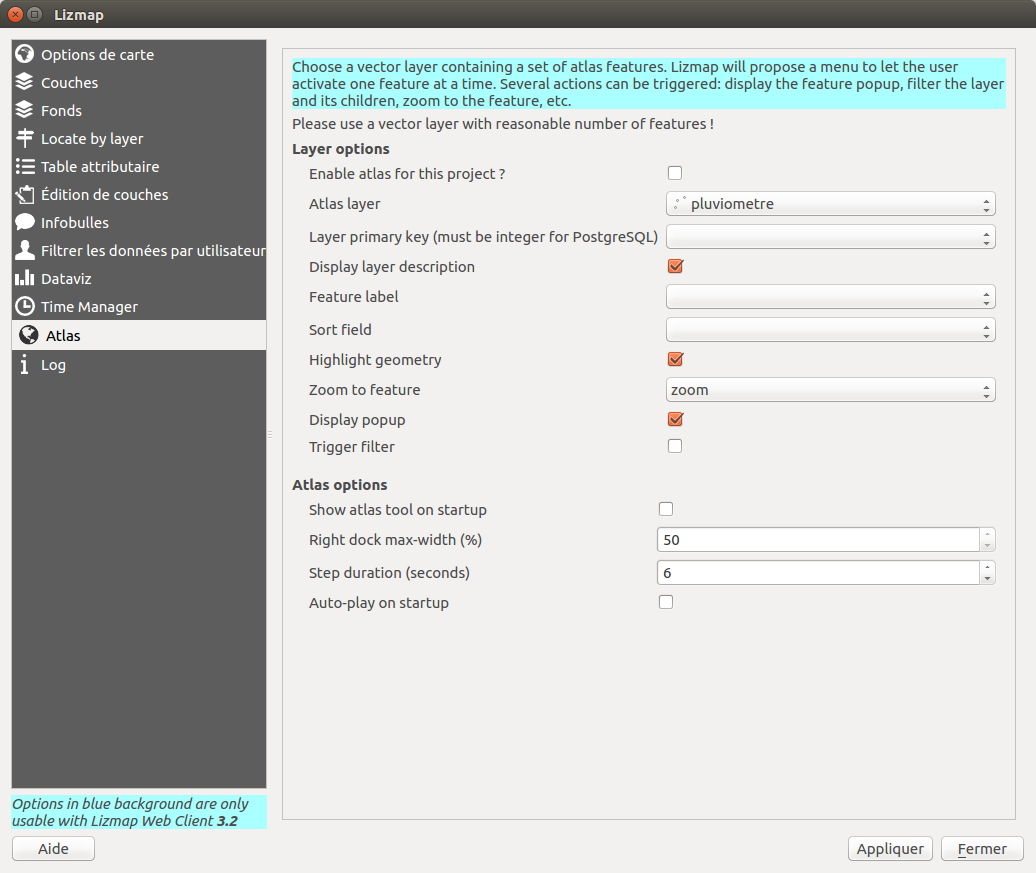
Layer options :
the atlas is enabled or not in your project
you need to chose the layer you want your atlas on
select the primary key field, it must be an integer
check if you want to display the layer description in the dock of your atlas
chose the field who contains the name of your features, it will be shown instead of the primary key in the list of features
your atlas will be sorted according to this field
you can chose to highlight the feature selected by the atlas, it will change every time it’s switching to a new feature
chose between a zoom on the feature or to make it the center of your map
you can chose to display the popup in the feature in the atlas container or not
check if you want to activate filter on the feature selected by the atlas, it will hide all other features of the layer and only show the one selected
Atlas options:
check if you want to open the atlas tool when you open your project
you can chose the size of the atlas dock (20%-50%)
you can select the duration between each step when your atlas is in auto-play mode
check if you want to launch the auto-play mode when you open your project
Form filtering - Filter layer data based on field values
Presentation
This tool, available since Lizmap Web Client 3.3, displays a form in the left panel, based on some fields, and allow the users to search among the layer data with a variety of form inputs: combo boxes, checkboxes, text inputs with autocompletion, date selector with sliders between the min and max date, etc..
It works only for database layers: PostgreSQL (recommended), Spatialite and GeoPackage, since Lizmap should query the data to retrieve:
the total count of features for the current filter
the unique values of some fields (for the Unique Values type for example)
the minimum and maximum of the numeric fields or date fields
the extent of the data for the current filter
You can see a video with an example: https://vimeo.com/331395259
Configuration
There is a new tab in the Lizmap plugin ( for QGIS 3 only) which lets you configure the filter inputs based on the layer fields. You can add one or more fields for one or more layer. If you add fields from 2 or more different layers, Lizmap Web Client will show a combo box to allow the user to choose the layer to filter. Selecting a layer will refresh the form and deactivate the current filter.
The layer must be published in the WFS capabilities group of the Project properties OWS Server tab.
You need to add a line in the plugin table for each field you need to add in the filter form. For each field, you need to configure some options:
Layer: the source layer.* Title: the title to give to the input, which will be displayed above the form input. For example «Choose a category» for a layer field called «category»
Type: the type of the form input, among one of the following: Text, Unique Values, Date, Numeric
Field: the field name (in the database table). Only for the Text, Unique Values and Numeric types.
Min date: the field containing the start date of your object (ex: «start_date» of an event). This is only needed for the Date type. If you have only one date field in your data, you should select it in the Min Date field.
Max date: the field containing the end date of your data. If you have 2 fields containing dates, one for the start date and another for the end date, you can differentiate them. If not, you need to use the same field name for Min date and Max date.
Format: the format of the Unique values type only. It can be select, which will show a combo box, or checkboxes which will show one checkbox for each distinct value. The distinct values are dynamically queried by Lizmap Web Client.
Splitter: for tje Unique values type only. Use if you want to split the field values by a separator. Ex: “culture, environment” can be split into “culture” and “environment” with the splitter “, “.
The order of the lines in the configuration table is taken into account to show the field inputs in the form.

Description of the different form input types
Text
This is the simplest type. With this type of input, the user will see a classical text input. You can type any text then validate. Autocompletion is enabled by default, which means Lizmap will retrieve the unique values for this field. This could be an option in the future if some datasets are too big and this autocompletion feature is too heavy.
The filter built will be like: «field» LIKE “%foo%”
Data
This input type will show a slider with 2 handles to allow to search between the two selected values. The two text inputs are also shown and can be used to manually set the min and max dates.
The date is «truncated» to a date (no time data such as hour, minutes or seconds yet).
The slider step is hard coded and equals to 86400 seconds, which means 1 day.
The filter built will be like: ` ( ( «field_date» >= “2017-04-23” OR «field_date» >= “2017-04-23” ) AND ( «field_date» <= “2018-06-24” OR «field_date» <= “2018-06-24” ) ) «`
Numeric
This input type will show a slider with 2 handles to allow to search between the two selected values. Two text inputs are also shown and can be used to manually set the min and max values.
The filter built will be like: ` ( ( «field» >= 100 ) AND ( «field_date» <= 200 ) ) «`
Unique values
Lizmap will query the data to get the distinct values of the field. You can choose two different input types: select or checkboxes.
If you have specified a splitter text, for example , `, Lizmap will find the unique values of the separated text values. Fo xample the value of one feature `”culture, environment” will be split into “culture” and “environment” with the splitter “, “. Selecting culture or environment in the form input will show this feature.
You can choose to show two different input types:
Combo box: this type will show a combo box with the list of distinct values for the field. The user will be able to choose only one item among the values.
Checkboxes: this type will show as many comboboxes as distinct values for the field. The data will be filtered with a UNION between checked items.
The filter built will be like: ( "field_thematique" LIKE “%Cuisine%” OR "field_thematique" LIKE “%Ecocitoyen%” )
Changing the default image of a project in the repositories and projects site
Por padrão, a seguinte imagem é apresentada para um projeto:
You can change this default image by adding in the same project folder a .png image with the exact project name and extension. Example: If the project is called montpellier.qgs you can add an image named montpellier.qgs.png. Note that the image has the project extension too.