Atributos de capas
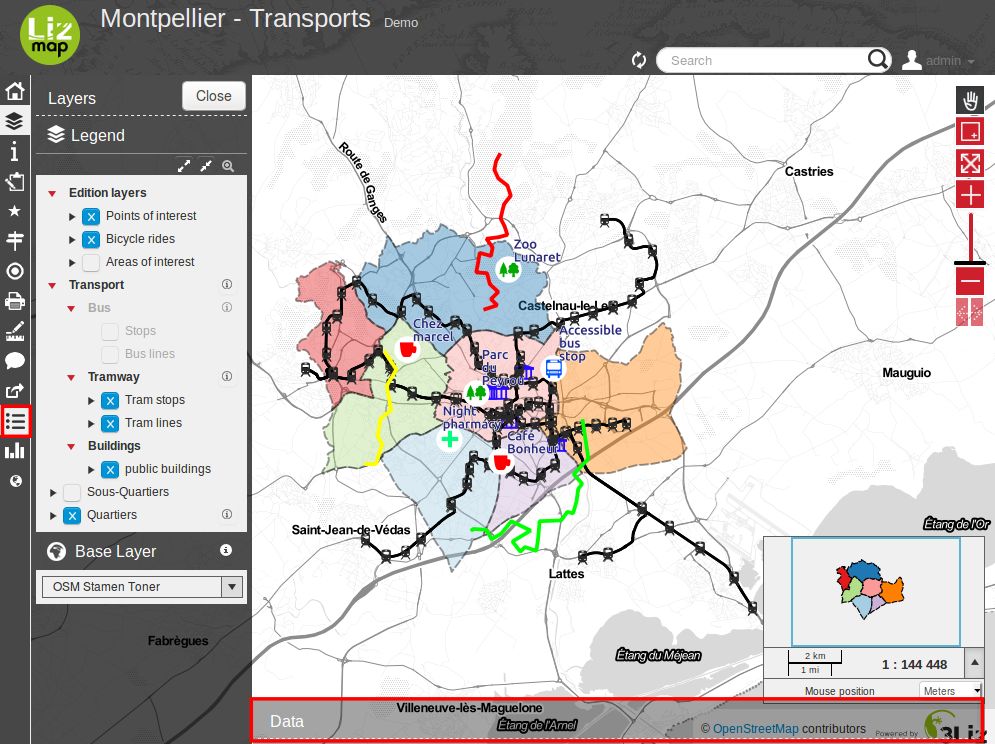
When this feature has been enabled by the map publisher for one or many vector layers, a new menu entry will be visible at the bottom of the menu bar, labelled as Data. Another entry labelled Selection with a star icon will also be displayed for a layer for which the attribute table has been activated.
Clicking on this icon will open a new panel situated at the bottom of the interface, containing one single Data tab with a list of published vector layers.
Comportamiento del panel de tabla de atributos
Since this panel is situated above the map, some default behaviours have been proposed to ease the consultation of the data in the map and in the table at the same time.
The attribute table panel takes half the size of the screen
It is automatically reduced at the bottom when the mouse is out of it, and automatically displayed back when the user moves the mouse over the bottom of the map.
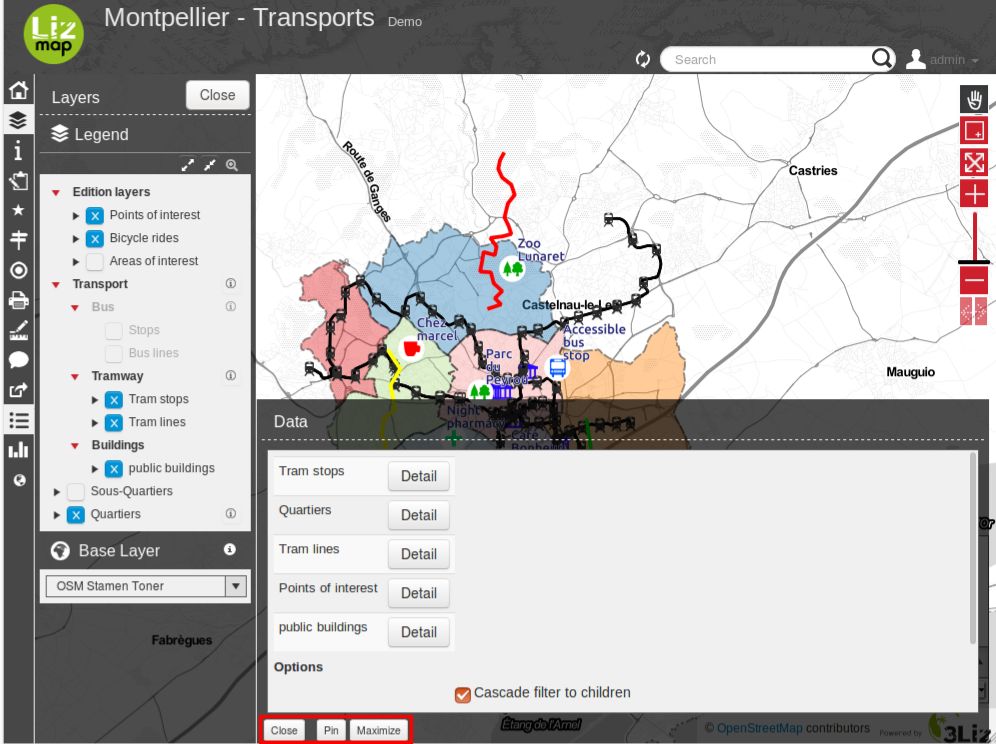
You can change the default behaviour by using the buttons displayed at the bottom of the attribute table panel
The Pin button deactivates the automatic reduction of the panel when the user mouse leaves it. But in this case, the whole panel will be displayed half transparent to allow the user to see the map underneath.
The Maximise button expands the panel so that it occupies the total place left between the left panel and the map header. This is handy when you need to have a confortable view of the layer data. In this configuration, the attribute table panel is also pinned, and won’t be reduced when the mouse leaves the panel, for example when hovering the left panel with the legend. But in this case, only the opacity of the attribute table panel will change so that you can see the map underneath.
You can click back on any of these 2 Pin and Maximise button to get back to the default behaviour.
The Close button closes the attribute table tool completely (as if you clicked in the menu bar icon).
Abrir la tabla de atributos para una capa
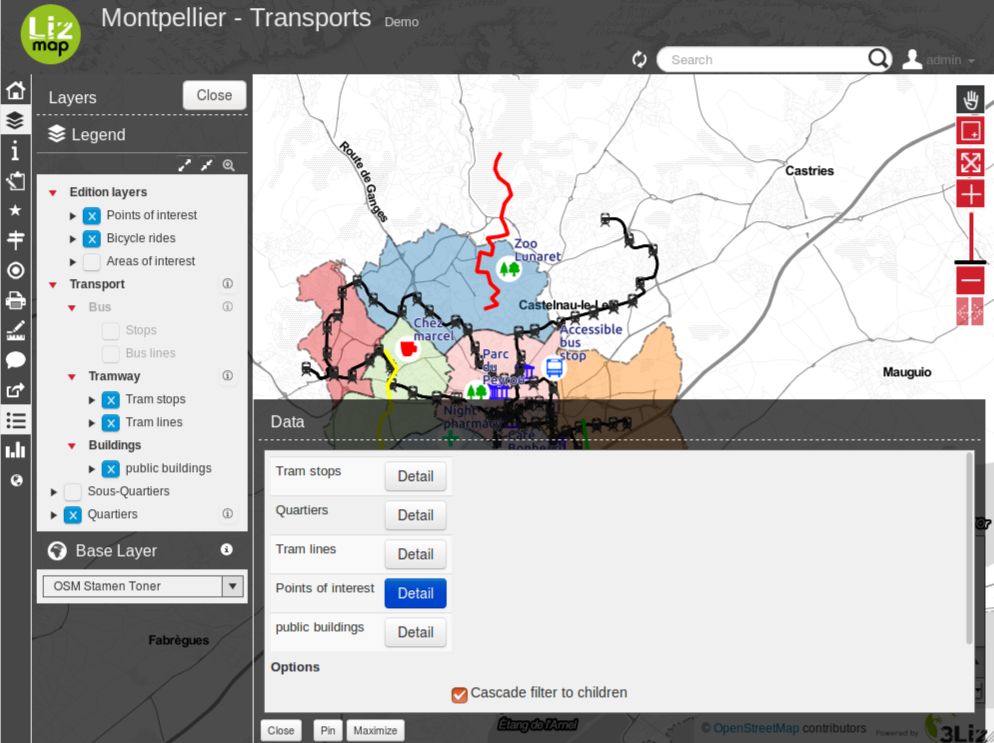
Once the attribute table panel is displayed, you can open the attribute table of each vector layer by clicking on the button situated right to the layer name. This will open a new tab labelled with the layer title which will show the attribute table for the chose layer.
Opening an attribute table can take some time depending on the data size and complexity.
Description of the attribute table functionality
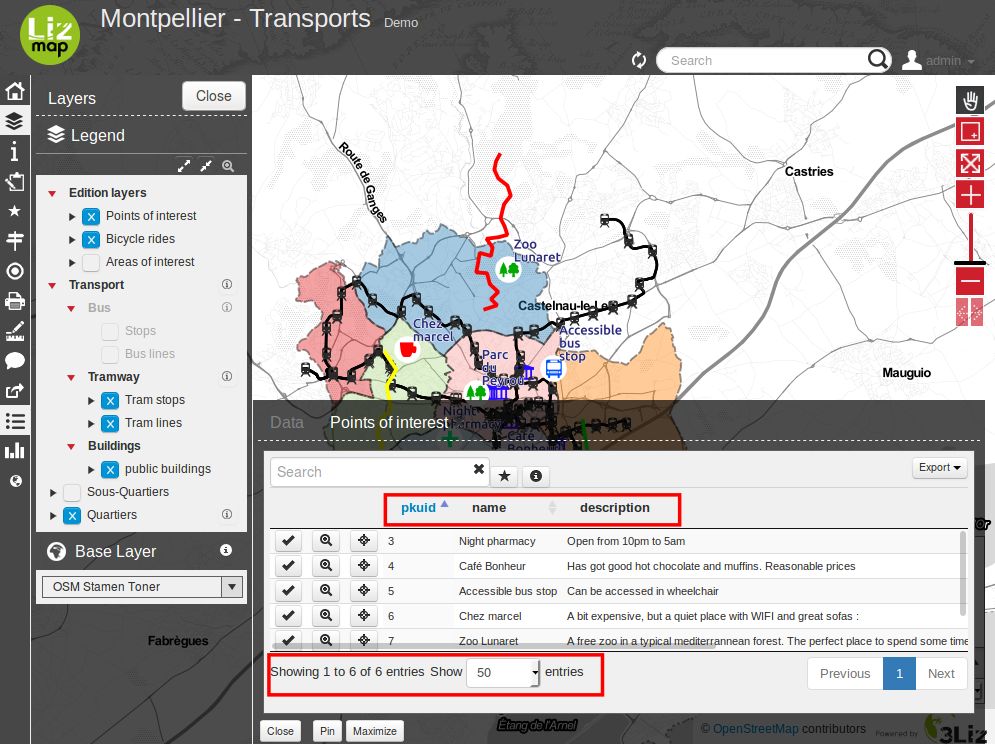
The layer data is shown in a paginated table. By default, the table shows 100 lines at a time. You can change this behaviour by using the list situated in the bottom left side of the tab content.
The table of data can be ordered by a field by clicking on the column corresponding to . If you click again on the column, the order will be reversed.
Actions on lines
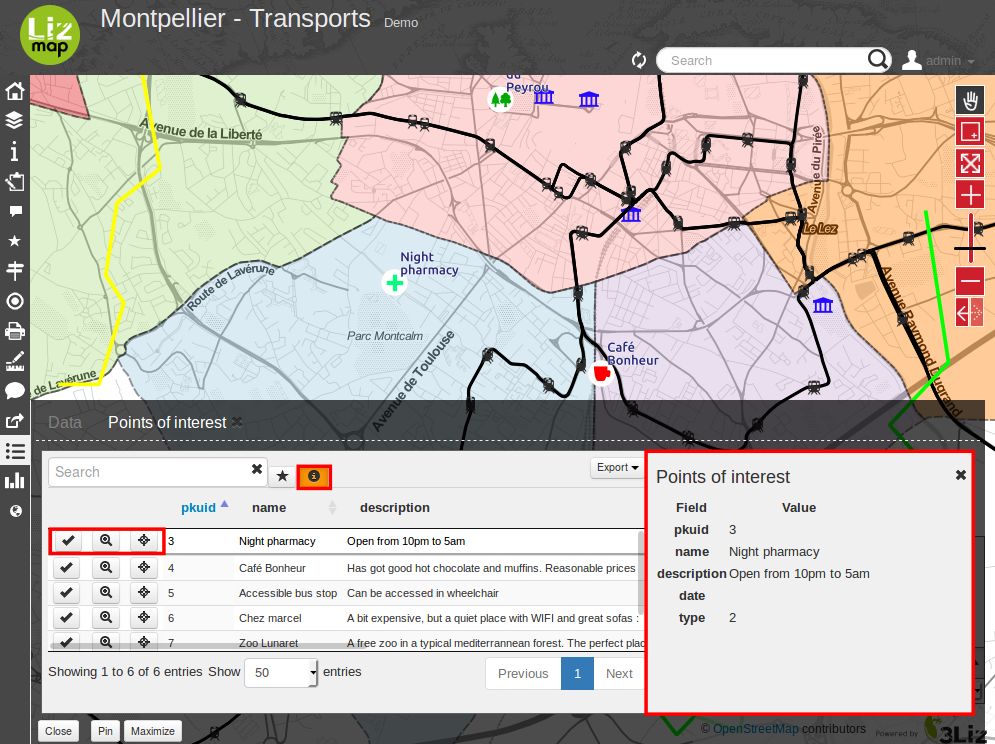
When you click on a table line, the line will be displayed with a border to help viewing which line is highlighted.
If the publisher has enabled the popup for the layer, you will be able to see the content of the popup for the highlighted feature by clicking on the (i) button (labelled with Display info when hovering the mouse on it). This will open a panel right to the table, which will display the detailed information on the highlighted table line. Furthermore:
Clicking on another line will refresh the right panel content with the new highlighted feature.
Clicking back on the (i) button or on the cross situated at the top right side of the information panel will hide the panel. To have the (i) button, you need to have activated the popup for the current layer.
Each line of the table shows some buttons at the left side:
Select button : when clicked, the corresponding feature is selected. You can select many lines by using this button on different lines. The selected features will be displayed in a different style on the map, usually with a Yellow color. You can click again on the «Select» to unselect a selected feature.
Zoom button : clicking on this button will zoom to the corresponding geometry in the map. The scale will be chosen so that the feature geometry uses most of the available space.
Center button : clicking on this button will just pan the map to the corresponding feature, without changing scale.
More about selection tools
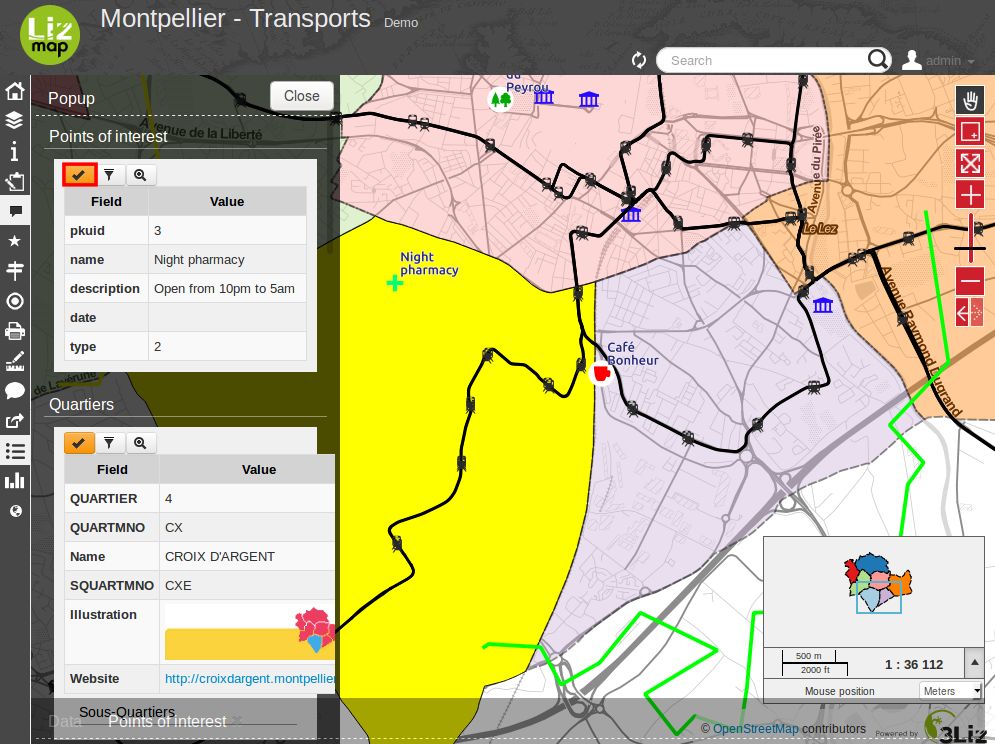
You can also select a layer object by displaying the popup for this object (if the map publisher has enabled the popup for the layer, a click on the map will show a popup window containing detailed information on the clicked feature). Inside the popup, if you can see the select button, you can use it to select only this object. Previous selection will be replaced by only this object.
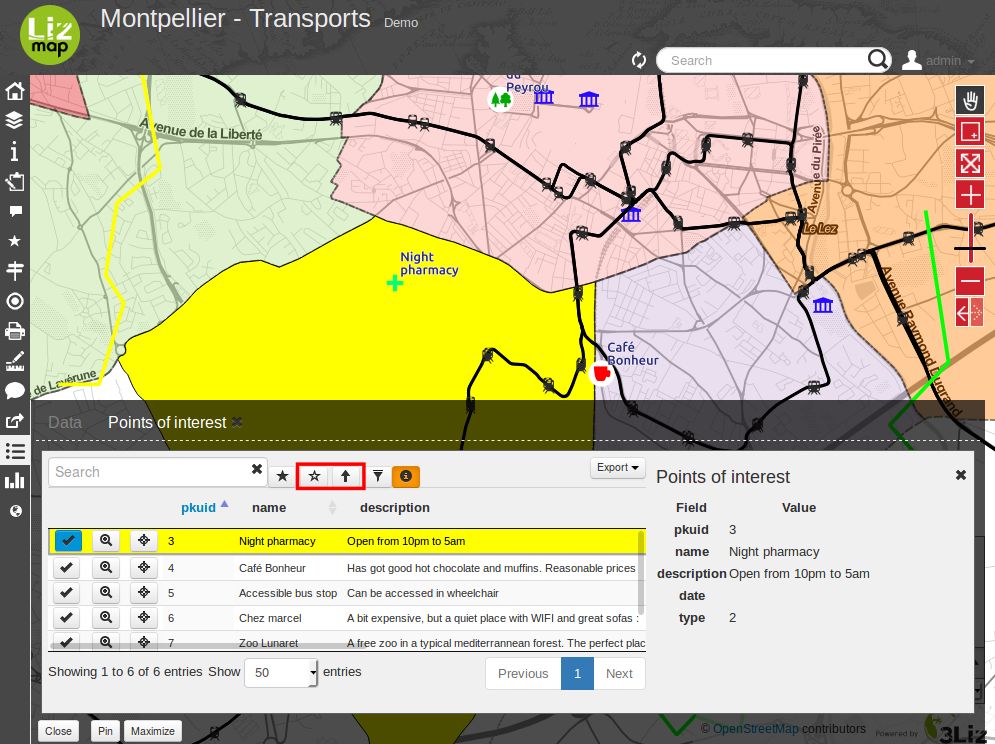
When one or more lines have been selected in the attribute table (they become yellow), you can use the black «arrow up» button situated above the table to move the selected lines at the top of the table.
You can unselect all the selected objects by clicking on the «white star» button situated above the table.
Quickly search through data
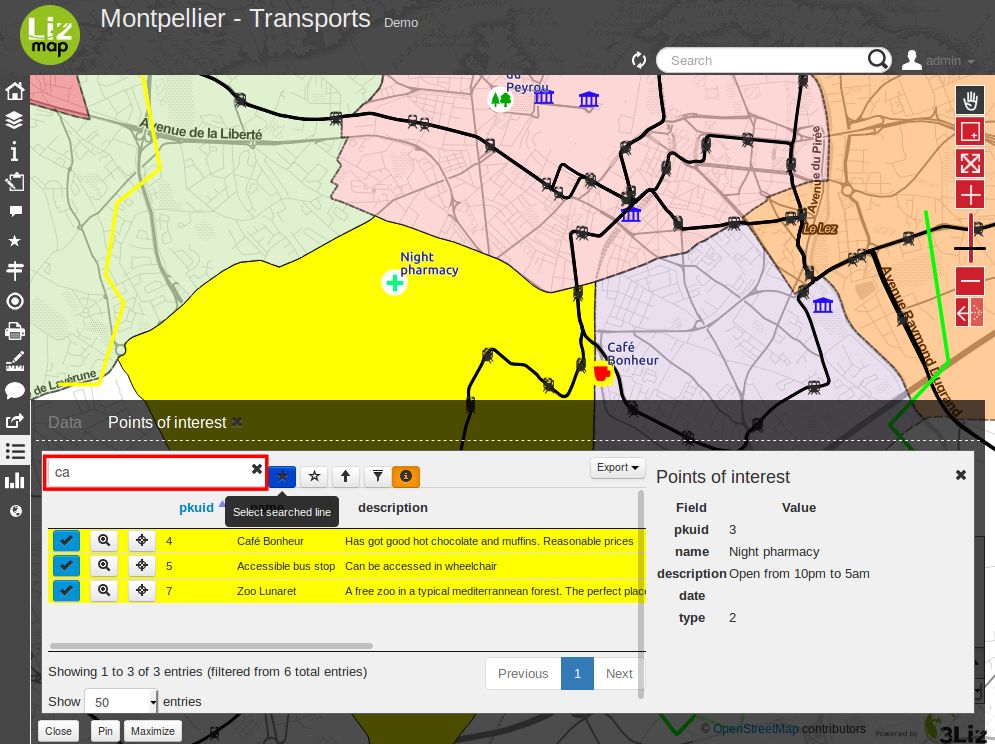
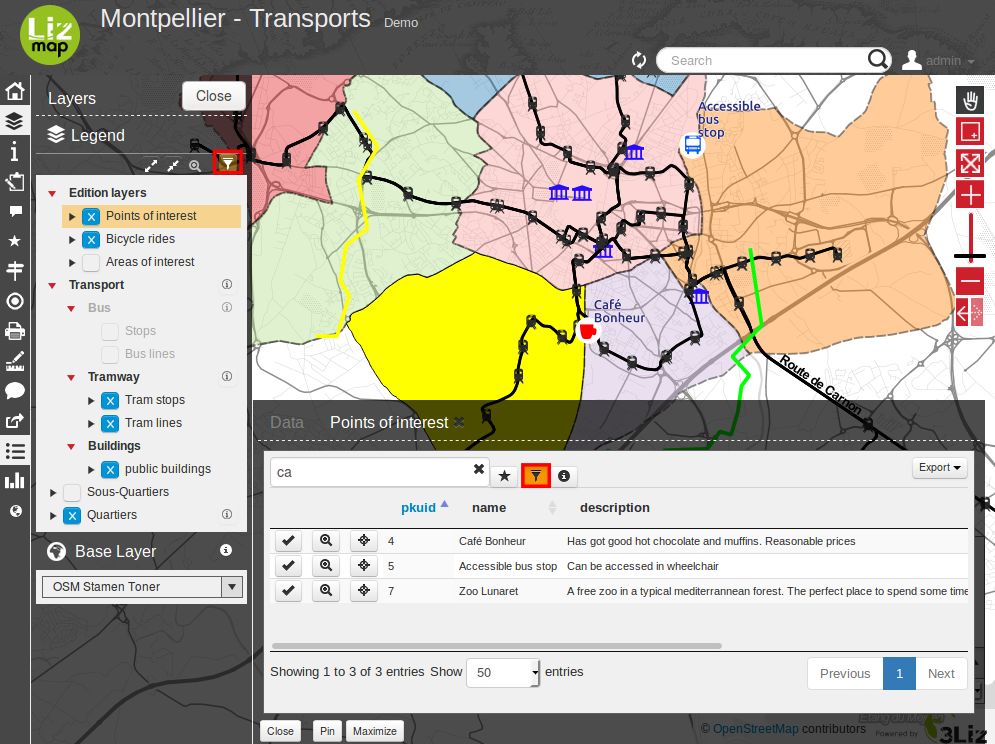
You can filter the lines displayed in the table by entering some letters in the Search field situated at the top left side of the tab content. If you want to see all the features again, just erase the search field content manually or by clicking on the cross button situated inside the field.
The text entered in the search field launches a search among the data for all the fields of the table.
Note that only the content of the table will be restricted to the lines matching your textual search. The objects on the map will not be filtered dynamically (but you could use select and filter to do so, see below)
Once you have filtered some data in the attribute table by entering some text in it, you can easily select them all by clicking on the «black star» button labelled «Select searched lines». This will select all the corresponding objects in the attribute table (display them in yellow) and also change their color in the map (usually in yellow too, depending on the configuration done by the map publisher)
Filter data
When you have selected one or more objects in the layer attribute table, you can then filter the data displayed in Lizmap for this layer. To do so, just click on the «Funnel» button labelled «Filter» situated above the table (only available if some the selection contains at least one object).
Filtering will have the following consequences:
The attribute table will show only the filtered data
The Search input field will allow to search only among filtered data
The map will show only the filtered objects
The child layers linked with relations (and also published in the attribute table tool) will be filtered too. We call it «cascading filtering». For example, the bus stops could be filtered automatically if you have filtered one bus line, to show only the ones served by the filtered line.
The filtered layers will be marked in the left panel legend with an orange background, and a new orange «Funnel» button will be displayed above the legend.
You can cancel the filter to go back to previous state:
by clicking on the orange «Funnel» button at the top of the legend in Lizmap left panel
by clicking back on the filter button just above the attribute table concerned by the filter
When exporting the map view with the permalink tool (situated in the menu bar), the filter will be activated in the linked map and the users won’t be able to easily unfilter the data : the unfilter button will not be displayed in Lizmap interface The only way would be to remove the filter parameters from the permalink URL. This is not a safe way to protect some data, but a way to focus on some data only.
