Advanced Configuration
Créer une carte de localisation
Pour ajouter une carte de localisation, ou carte miniature, dans la carte Lizmap, il suffit de :
Create an independent group in the QGIS project called Overview (with the 1st letter capitalized)
Y ajouter des couches, par exemple une couche de communes, un fond relief allégé, etc.
All layers and groups in the Overview group will not be shown in the lizmap’s map legend. They are drawn only in the Overview map.
Il est conseillé d’utiliser :
des couches vectorielles légères et simplifiées si nécessaire
d’utiliser une sémiologie adaptée : traits fins et étiquettes cachées ou petites
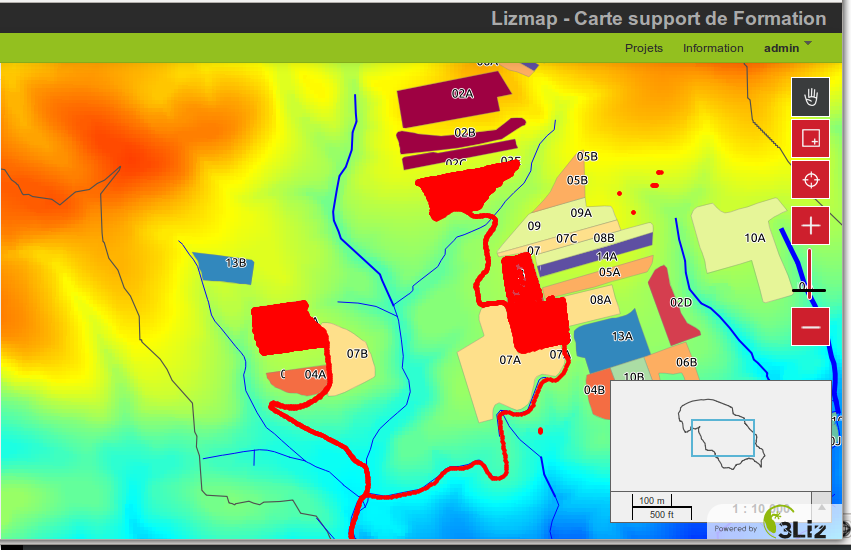
Voici un exemple d’utilisation :
Add the localization function
L’idée de cet outil est de présenter à l’utilisateur de Lizmap Web Client une liste déroulante qui permet de zoomer automatiquement sur un ou plusieurs objets spatiaux de la couche.
Cas d’utilisation
Prenons comme exemple une couche vectorielle spatiale Quartiers contenue dans le projet QGIS. On choisit d’ajouter ces quartiers dans l’outil Localiser par couche, pour permettre aux utilisateurs de Lizmap Web Client de se positionner rapidement sur un des quartiers.
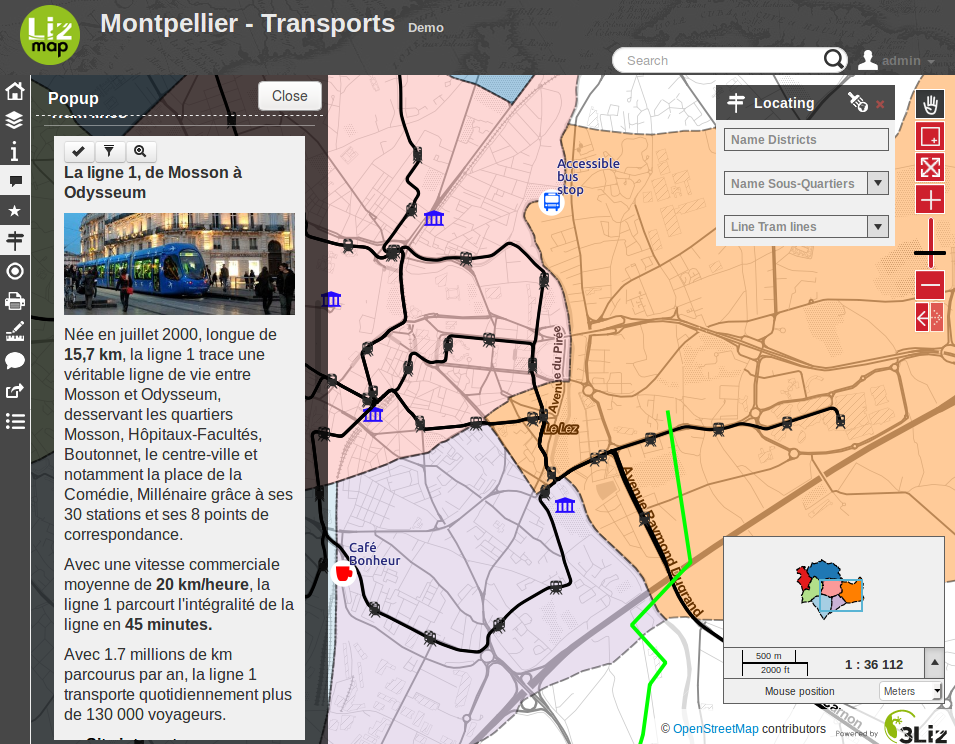
Une fois cette couche ajoutée dans l’outil Localiser par couche, une liste déroulante contenant les quartiers s’affiche sur l’interface web de Lizmap.
Lorsque l’utilisateur de la carte web sélectionne un nom dans cette liste, la carte se recentre automatiquement sur le quartier sélectionné, et la géométrie du quartier s’affiche (en option).
Pré-requis
Note
The layer(s) you want to use must be published as WFS layer: check the corresponding box of the WFS capabilities in the OWS Server tab of the Project Properties window.
How to
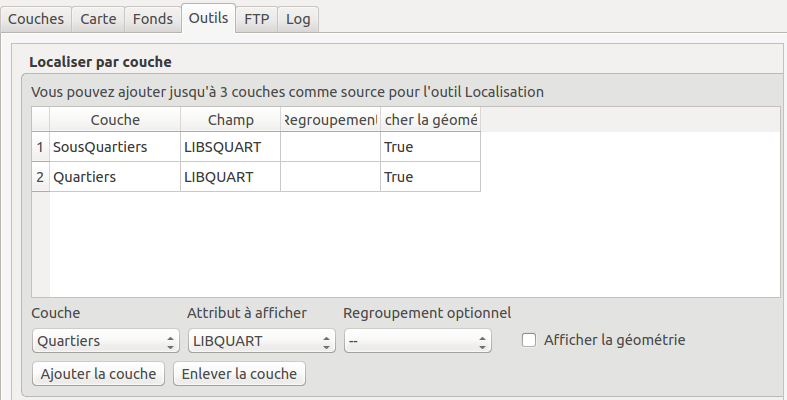
Pour ajouter une couche à cet outil :
choisissez la couche via la première liste déroulante parmi les couches vectorielles du projet,
puis la colonne qui contient le libellé que vous souhaitez afficher dans la liste déroulante.
Si vous souhaitez que la géométrie liée aux objets soit aussi affichée sur la carte lorsque l’utilisateur sélectionne un élément de la liste, alors on coche l’option Afficher la géométrie.
finally click the button Add layer to add it to the list.
To remove a layer already configured:
select the line of the layer you want to remote by clicking on it
click on the button Remove layer.
Listes hiérarchiques
Si on reprend l’exemple des quartiers, il peut être intéressant de proposer aussi à l’utilisateur une liste déroulante des sous-quartiers. On souhaite que lorsque l’utilisateur choisit un quartier, alors la liste déroulante des sous-quartiers soit automatiquement filtrée pour n’afficher que les sous-quartiers du quartier choisi.
Pour cela, il existe 2 méthodes :
soit on a 2 couches vectorielles distinctes : une pour les quartiers, et une pour les sous-quartiers. Alors il faut utiliser une jointure attributaire entre les 2 couches pour activer le filtrage automatique des listes dans Lizmap.
soit on n’a qu”1 seule couche des sous-quartiers, et alors on peut spécifier via le plugin l”attribut de regroupement. Deux listes déroulantes seront créées au lieu d’une seule dans l’application Web.
Note
Up to 3 project layers can be added to the Locate by layer tool.
Note
Don’t forget to check if your configuration of Qgis server is the right one (in Lizmap : My account -> Lizmap configuration -> check if the qgis server version is the right one, if not, you can use the button “modify” below). If the configuration is not right the location will be wrong!
Requête spatiale
In the map options, you can activate and configure the address search bar, based on external web services (nominatim, google or french IGN). See Configure the map . Additonaly, you can add spatial searching capability to Lizmap. This means you will allow the users to search within spatial data, such as countries, points of interests, etc. You have two ways to add searching capability in Lizmap:
since version 3.1, you can use the plugin QuickFinder to configure a data search per QGIS project.
since version 3.2, you can create a table or view lizmap_search in your PostgreSQL database to store the search data for all your Lizmap projects.
Plugin QuickFinder
Le but de ce plugin est de fournir une recherche rapide au sein d’un grand volumes de données, en réalisant des recherches dans un fichier qtfs généré par QGIS Desktop.
Pré-requis
Vous devez avoir installé a minima la version « 7.x » de « PHP » sur votre serveur Lizmap.
It is available only since version 3.1 of Lizmap Web Client.
Configuration
Depuis QGIS :
install QuickFinder Plugin
choose a layer(s), define the fields to search among, pick the geometry storage format (WKT or Extent) and store Full Text Searchs (FTS) vector into a file database (.qfts). The filename must be identical to the QGIS project filename. Ex: myproject.qfts for a QGIS project stored as myproject.qgs
Note
Seuls les formats WKT ou Extent pour le stockage des géométries fonctionne, car le format binaire (WKB) ne peut pas être décodé par LWC.
Inside LWC (available since version 3.1):
placez le fichier de base de données à côté du projet QGIS, utilisez l’outil de recherche (champs de saisie) et effectuez un zoom sur la fonction choisie.
Recherche PostgreSQL
When you have many projects and data, the best solution to provide searching capabilities is to set up a dedicated relation (table or view) inside your database. Since version 3.2, Lizmap allows to use a PostgreSQL database to store the search data.
Pré-requis
a PostgreSQL database, accessible from Lizmap Web Client
PostgreSQL extensions activated in this database : unaccent and pg_trgm (for effective LIKE queries)
A custom function f_unaccent which can be used in an index. See this Stack Overflow post for explanation
-- Add the extension pg_trgm
CREATE EXTENSION IF NOT EXISTS pg_trgm;

-- Add the extension unaccent, available with PostgreSQL contrib tools. This is needed to provide searches which are not sensitive to accentuated characters.
CREATE EXTENSION IF NOT EXISTS unaccent;

-- Add the f_unaccent function to be used in the index
CREATE OR REPLACE FUNCTION public.f_unaccent(text)
RETURNS text AS
$func$
SELECT public.unaccent('public.unaccent', $1)  -- schema-qualify function and dictionary
$func$ LANGUAGE sql IMMUTABLE;
Note
We choose to use the pg_trgm extension and this custom f_unaccent function instead of the Full Text Search (FTS) tool of PostgreSQL, to keep the tool as simple as possible and avoid the need to create FTS « vectors » in your search data.
Créer la table de recherche Lizmap ou la vue
The database admin must create a table, view or materialized view called lizmap_search. This relation must be accessible in the search_path (you can put it in the public schema, or configure the search_path variable for the database or the user which connects to the database).
The relation « lizmap_search » must contain the following columns:
item_layer (text). Name of the layer. For example « Countries »
item_label (text). Label to display the results, which is the data to search among. Ex: « France » or « John Doe - Australia ». You can build it from a concatenation of several fields values.
item_project (text). List of Lizmap projects separated by commas. Optionnal. When set, the search will be done only for the specified Lizmap projects
item_filter (text). Username or group name. When given, the results will be filtered by authenticated user login and groups. For example, “admins”
geom (geometry). We advise to store all the geometries with the same SRID.
Voici un exemple de code SQL que vous pouvez utiliser, pour ajouter des données issues de deux tables spatiales différentes dans la recherche lizmap (ici en tant que vue matérialisée pour faciliter une maintenance ultérieure)
DROP MATERIALIZED VIEW IF EXISTS lizmap_search;
CREATE MATERIALIZED VIEW lizmap_search AS
SELECT
    'Commune' AS item_layer, -- name of the layer presented to the user
    concat(idu, ' - ', tex2) AS item_label, -- the search label is a concatenation between the 'Commune' code (idu) and its name (tex2)
    NULL AS item_filter, -- the data will be searchable for every Lizmap user
    NULL AS item_project, -- the data will be searchable for every Lizmap maps (published QGIS projects)
    geom -- geometry of the 'Commune'. You could also use a simplified version, for example: ST_Envelope(geom) AS geom
FROM cadastre.geo_commune
UNION ALL -- combine the data between the 'Commune' (above) and the 'Parcelles' (below) tables
SELECT
    'Parcelles' AS item_layer,
    concat(code, ' - ', proprietaire) AS item_label,
    'admins' AS item_filter, -- only users in the admins Lizmap group will be able to search among the 'Parcelles'
    'cadastre,urban' AS item_project, -- the Parcelles will be available in search only for the cadastre.qgs and urban.qgs QGIS projects
    geom
FROM cadastre.parcelle_info
;
Optimisation
Vous devriez utiliser une table, ou une vue matérialisée sur laquelle vous pouvez ajouter des index pour accélérer les requêtes de recherche.
We strongly advise you to add a trigram index on the unaccentuated item_label field, to speed up the search query:
-- Create the index on the unaccentuated item_label column:
DROP INDEX IF EXISTS lizmap_search_idx;
CREATE INDEX lizmap_search_idx ON lizmap_search USING GIN (f_unaccent(item_label) gin_trgm_ops);

-- You can refresh the materialized view at any time (for example in a cron job) with:
REFRESH MATERIALIZED VIEW lizmap_search;
At present, Lizmap PostgreSQL search cannot use 3D geometries, or geometries with Z or M values. You have to use the ST_Force2D(geom) function to convert geometries into 2D geometries.
Configurer l’accès
Une fois que cette table (ou vue ou vue matérialisée) est créée dans votre base de données, vous devez vérifier que Lizmap a un accès en lecture dessus.
If your Lizmap instance uses PostgreSQL to store the users, groups and rights, a connection profile already exists for your database. Then you can just add the lizmap_search relation inside this database (in the public schema).
If not, or if you need to put the search data in another database (or connect with another PostgreSQL user), you need to add a new database connection profile in Lizmap configuration file lizmap/var/config/profiles.ini.php. The new profile is a new jdb prefixed section, called jdb:search. For example, add the following section (please replace the DATABASE_ variables by the correct values):
[jdb:search]
driver="pgsql"
database=DATABASE_NAME
host=DATABASE_HOST
user=DATABASE_USER
password=DATABASE_PASSWORD
; search_path=DATABASE_SCHEMA_WITH_LIZMAP_SEARCH,public
You don’t need to configure the locate by layer tool. You can now use the default search bar in lizmap.

Media in Lizmap
Use principle
Il est possible de mettre à disposition des documents à travers Lizmap. Pour cela il faut simplement :
create a directory called media (in lower case and without accents) at the same level as the QGIS project
place documents in it: pictures, reports, pdfs, videos, HTML or text files
the documents contained in this media directory must be synchronized as other data
you can use subdirectories per layer or theme: the organization of media directory content is free.
Ensuite dans Lizmap Web Client, on peut offrir un accès à ces documents pour 2 choses :
the popups: the content of one or more field for each geometry can specify the path to the media. For example a photo or pdf field
the link provided for each group or layer in the Lizmap plugin Layers tab.
Le détail de ces utilisations est précisé ci-dessous.
Utilisation pour les liens
It is possible to use a relative path to a document for layers or groups link.
Note
Links can be filled with the Lizmap plugin Layers tab after selecting the layer or group. See Configurer vos couches pour le Web
Le chemin doit être écrit :
starting with media/
with slashes / and not backslashes
Quelques exemples :
media/my_layer/metadata_layer.pdf
media/reports/my_report_on_the_layer.doc
media/a_picture.png
Sur la carte de Lizmap Web Client, si un lien a été configuré de cette manière pour une des couches, alors une icone (i) sera placée à droite de la couche. Un clic sur cet icône permet d’ouvrir le document lié dans un nouvel onglet du navigateur.
Utilisation dans les popups
Principe
Comme décrit dans l’introduction ci-dessus, on peut utiliser un chemin de media dans les données de la couche spatiale.
Par exemple, si on souhaite que les popups liées à une couche affichent une photo qui dépende de chaque objet, il suffit de créer une nouvelle colonne qui contiendra le chemin de media vers la photo pour chaque ligne de la table attributaire de la couche. Et ensuite d’activer les popups pour cette couche.
Exemple
Here for example the attribute table of a layer landscape configured to display pictures in the popup. The user has created a picture field in which he places the path to the pictures, and a pdf field in which he puts the paths to a pdf file describing the object corresponding to each line.
id |
nom |
description |
photo |
|
|---|---|---|---|---|
1 |
Marais |
blabla |
media/photos/photo_1.png |
media/docs/paysage-1.pdf |
2 |
Plage |
blibli |
media/photos/photo_2.png |
media/docs/paysage-2.pdf |
3 |
Lande |
bloblo |
media/photos/photo_3.png |
media/docs/paysage-3.pdf |
Note
In this example, we see that the pictures and pdf file names are normalized. Please follow this example because it allows using the QGIS Field Calculator to create or update automatically the media column data for the entire layer.
Résultat
Voici les règles d’affichage dans la popup
if the path points to a picture, the image will be displayed in the popup. Clicking on the picture will display the original image in a new tab
if the path points to a text file or HTML file, the file contents will be displayed in the popup
for other file types, the popup will display a link to the document that users can download by clicking on the link.
Illustration
Ci-dessous, une illustration d’une popup Lizmap affichant une photo, un texte et un lien dans la popup :
How to configure popups
Activate popups
With the plugin, you can activate popups for a single layer or for a group configured with the « Group as layer » option.
Just click on the checkbox Activate popups of the tab Layers on the Lizmap plugin interface. For the Group as layer option you must select the option for the group and for all the layers included you want to show in the popup: in this case, only the layers with the option Popup checked will be shown.
Il existe trois types de popup :
auto
lizmap
qgis
In the web application Lizmap Web Client, a click on a map object will trigger the popup if (and only if):
la couche est cochée dans la légende, et donc visible
the popup has been activated through the plugin for the layer or the group
l’utilisateur a bien cliqué sur un endroit de la carte où on voit de la donnée pour l’une des couches avec les popups actives.
Note
For point layers you need to click in the middle of the point to display the popup. The tolerance can be setup in tab Map options then Map tools.
You can update where the popup is displayed in the web interface in Map options then Map interface. You can choose between:
dock
minidock
map
bottomdock
right-dock
Popup automatique
The Lizmap Web Client auto popup displays a table showing the columns of the attribute table in two columns Field and Value, as shown below:
Champ |
Valeur |
|---|---|
id |
1 |
nom |
Un nom |
description |
Cet objet … |
photo |
:-) |
On peut modifier un peu les informations affichées via QGIS, et aussi afficher des images ou des liens.
Configuration simple des popups
Via le plugin, si on clique seulement sur la case à cocher Activer les popups sans modifier le contenu via le bouton Contenu, alors c’est l’affichage par défaut ou mode simple qui est utilisé.
On peut néanmoins jouer sur plusieurs choses dans QGIS et via le plugin Lizmap pour paramétrer les champs qu’on veut afficher, renommer les champs, et même afficher des images, des photos ou des liens vers des documents internes ou externes.
Masquer une colonne ou modifier son nom
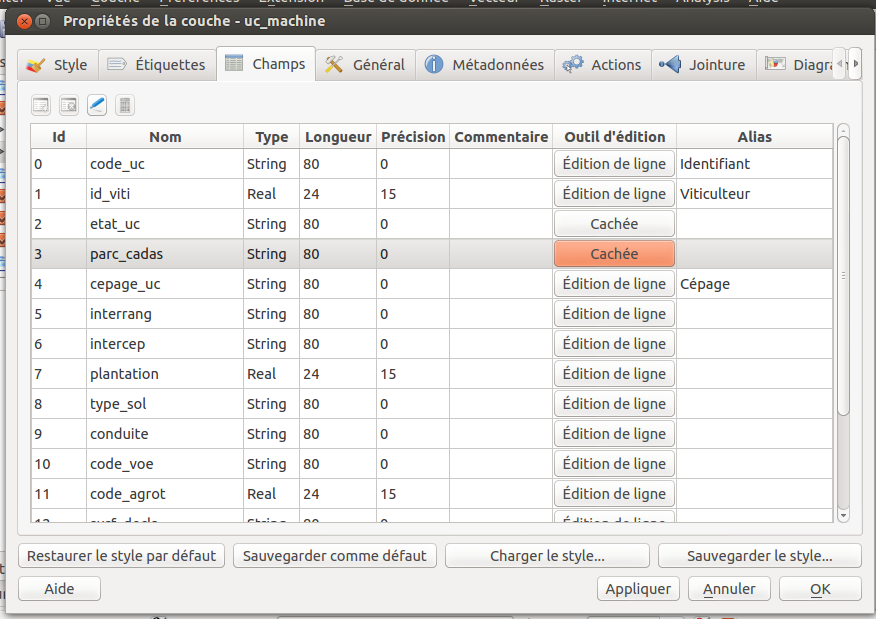
You can use the tools available in the Fields tab of the Layer properties, in QGIS:
to avoid displaying a column in the popup, uncheck the relative WMS checkbox. The WMS column is on the right
to change the name displayed for that column, type a different name in the Alias column
Utilisation de médias : images, documents, etc.
If you use paths to documents of the media directory, you can:
display the image found at that link
display the content (text or HTML) of the file
display a link to a document
Voir aussi
Chapter Media in Lizmap for more details on the usage of documents of the directory media in the popups.
Utilisation de liens externes
Enfin on peut aussi utiliser dans les colonnes des liens Web complets vers une page ou une image:
l’image pointée par le lien sera affichée à la place du lien
le lien web sera affiché et cliquable
Popup lizmap
Introduction
If the simple table display does not suit your needs, you can write a popup template. To do so, you should know well the HTML format. See e.g.: http://html.net/tutorials/html/
Avertissement
lorsque vous utilisez le mode lizmap, la configuration précédente ne fonctionne plus pour renommer un champ : c’est vous qui contrôlez via le modèle les affichages. La gestion des médias est encore possible, mais c’est à vous de bien la prévoir.
Mise en oeuvre
Via le bouton Configurer du plugin Lizmap, on peut modifier le modèle de la popup. En cliquant sur ce bouton, une fenêtre s’affiche avec 2 zones de texte :
une zone de texte éditable qui permet d’écrire le contenu
une zone de texte en lecture seule qui montre un aperçu de la mise en forme
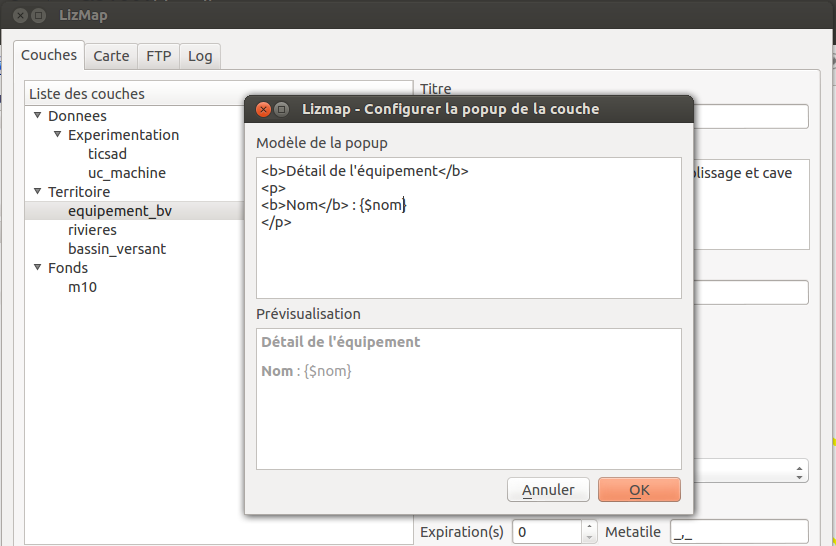
On peut écrire du texte simple, mais il est conseillé d’écrire au format HTML pour le mettre en forme. On peut par exemple utiliser les paragraphes, les titres, etc
<h3>A Title</h3>
<p>An example of paragraph</p>
Le comportement est le suivant:
Si le contenu des 2 champs texte est vide, un tableau sera présenté dans la popup (modèle par défaut)
Si le contenu n’est pas vide, le modèle écrit dans le contenu sera utilisé à la place pour l’affichage de la popup
Lizmap Web Client sait remplacer automatiquement une variable représentant le nom d’un champ de la table attributaire par son contenu. Pour ajouter le contenu d’une colonne dans la popup, on utilise le nom de la colonne précédé d’un dollard, le tout encadré d’accolades. Par exemple:
<h3>A Title</h3>
<p>An example of paragraph</p>
<p>A name: <b>{$name}</b></p>
<p>Description: {$description}</p>
Note
Si vous avez choisi un alias pour un champ, vous devez utiliser l’alias plutôt que le nom, entre crochets.
On peut aussi utiliser les valeurs des colonnes comme paramètres pour styliser le texte. Par exemple ici pour mettre le fond dans la couleur de la ligne de bus:
<p style="background-color:{$color}">
<b>LINE</b> : {$ref} - {$name}
<p/>
Utilisation des médias et des liens externes
On peut utiliser les médias référencés dans le contenu des champs de la table attributaire, même si on configure un modèle de template. Pour cela, il faut utiliser les colonnes de média en anticipant le fait que Lizmap-Web-Client remplace automatiquement le chemin relatif de type /media/monfichier.jpg par l’URL complète avec laquelle on peut y accéder depuis l’interface WEB.
On peut aussi utiliser des URL complètes pointant vers les liens ou des images hébergées sur un autre serveur.
Voici un exemple de contenu d’un modèle gérant les médias et utilisant un lien externe: :
 <p style="font-size:0.8em;">A Title</p>
 <p>The name is {$name}</p>
<p>
   A sample image<br/>
   <img src="{$image_column}" style="">
 </p>

 <p><a href="{$website}" target="_blank">Web link</a></p>

 <p><img src="http://www.3liz.com/assets/img/logo.png"/></p>
Voir aussi
Chapter Media in Lizmap for more details on the use of documents in the directory media.
Popup QGIS
QGIS popups can be configured via QGIS –> Layer properties –> Tooltips –> HTML, using the same syntax as for the lizmap popups. The main advantages of this approach are:
Vous pouvez utiliser des variables et expressions QGIS, ce qui permet d’ajouter de l’information créé dynamiquement
the popup can be previewed in QGIS, using tooltips
La configurations des popups est enregistrée dans le projet QGIS et le style de la couche, donc elle peut-être réutilisée dans d’autres projets Lizmap sans avoir à recopier la configuration.
Relations 1 à n
It is possible to display multiple objects (photos, documents) for each geographical feaature. To do so, you have to configure both the QGIS project and the Lizmap config.
Dans le porjet QGIS :
Use 2 separate layers to store the main features and the pictures. For example « trees » and « tree_pictures ». The child layer must contain a field referencing the parent layer id
Configure aliases and field types in tab Fields of the layers properties dialog. Use « Photo » for the field which will contains the relative path to pictures
Add a relation in QGIS project properties between the main layer « trees » and the child layer « tree_pictures »
Add data to the layers. You should use relative path to store the pictures path. Theses paths must refer to a project media subdirectory, for example: media/photos/feature_1_a.jpg
Dans le plugin Lizmap :
In the Layers tab, activate popup for both layers. You can configure popup if you need specific layouts ( See documentation on popups )
For the parent layer, activate the option « Display relative children under each object (use relations) »
Add the two layers in the Attribute table tab
Vous pouvez éventuellement activer l’édition pour les deux couches, pour permettre aux utilisateurs Web de créer de nouveaux objets et d’uploader des images
Enregistrez et publiez votre projet et la configuration de Lizmap
Link of an element for layers with an atlas
Every element of a layer with an atlas configured will have a link at the end of his popup which open a pdf of the atlas for this particular element. To make it work you will need to download the « atlas_print » plugin, for that you have to get it from his Github at : https://github.com/3liz/qgis-atlasprint
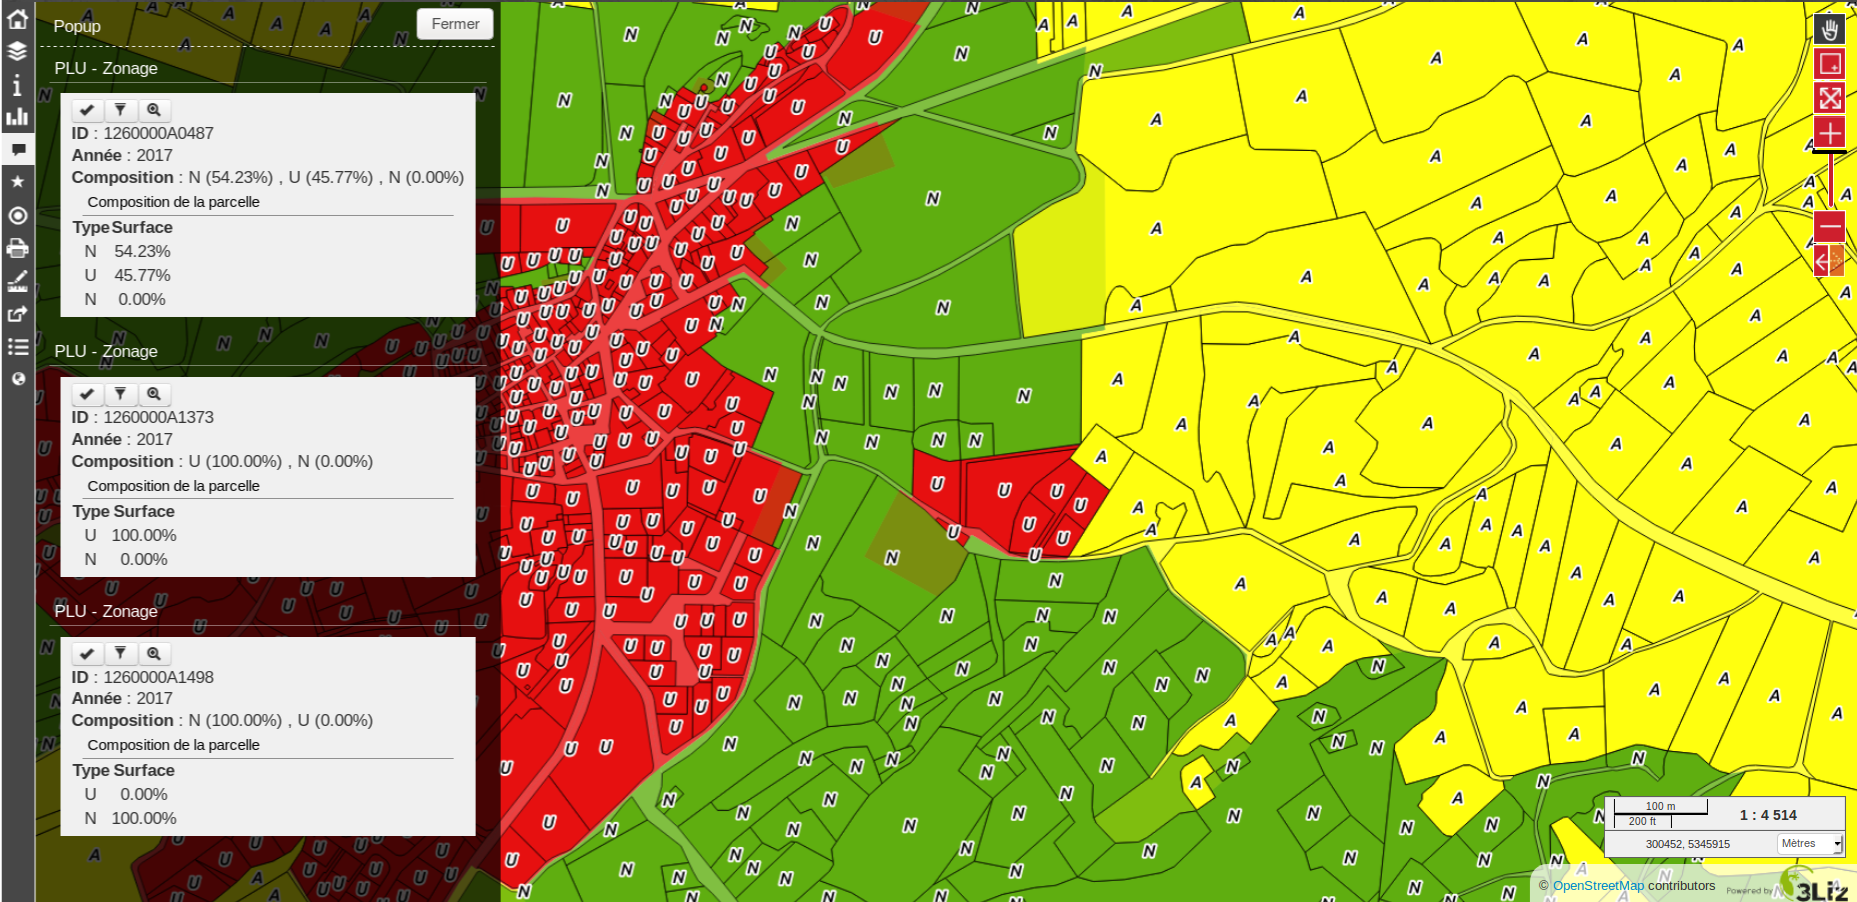
Affichez les enfants de manière compacte
Vous pouvez changer la manière dont les enfants sont affichés et les faire ressembler à une table. Pour cela, vous devez adapter le code HTML de votre couche enfant et utiliser quelques classes pour le manipuler.
« lizmap_merged » : Vous devez attribuer cette classe à votre table.
lizmapPopupHeader : If you want to have a better display of your headers, you will need to put this class in the “<tr>” who contains them
lizmapPopupHidden : This class permit you to hide some elements of your children that you want to hide when there are used as a child but you still want to see them if you display their popup as a main Popup
Voici un exemple :
<table class="lizmap_merged">
 <tr class="lizmapPopupHeader">
     <th class="lizmapPopupHidden"><center> Idu </center></th>
     <th> <center> Type </center> </th>
     <th> <center> Surface</center> </th>
  </tr>
  <tr>
     <td class="lizmapPopupHidden"><center>[% "idu" %]</center></td>
     <td><center>[% "typezone" %]</center></td>
     <td><center>[% "surface" %]</center></td>
  </tr>
</table>
Créer des thèmes simples
Starting from Lizmap Web Client version 2.10, it is possible to create themes for all maps of a repository or for a single map. This function needs to be activated by the administrator and uses the directory media Media in Lizmap.
Le principe est le suivant :
the directory
mediacontains a directory namedthemesthe directory
themescontains a default directory for the theme of all the maps of the repositorythe directory
themesmay contain a directory per project, for the themes specific for each project
-- media
  |-- themes
    |-- default
    |-- map_project_file_name1
    |-- map_project_file_name2
    |-- etc
In order to simplify the creation of a theme for a repository or a map, Lizmap allows you to obtain the default theme fro the application, through the request: index.php/view/media/getDefaultTheme.
Cette requête renvois un fichier zip contenant le theme par défaut avec la structure suivantes :
-- lizmapWebClient_default_theme.zip
  |-- default
    |-- css
      |-- main.css
      |-- map.css
      |-- media.css
      |-- img
        |-- loading.gif
        |-- etc
      |-- images
        |-- sprite_20.png
        |-- etc
Une fois que vous avez récupéré le contenu du thème par défaut, vous pouvez :
remplacer les images
modifier les fichiers CSS
Avertissement
Les fichiers et les dossiers doivent avoir la permission d’écriture (755:644)
To preview your results just add &theme=yourtheme at the end of your URL (e.g. https://demo.lizmap.3liz.com/index.php/view/map/?repository=montpellier&project=montpellier&theme=yourtheme).
Une fois que votre thème est prêt, il vous suffit de le publier avec le dossier media et les projets.
Ajouter votre propre JavaScript
Purpose
This is useful for a variety of advanced usage. For instance, you can avoid people being able to download elements of the page by right clicking on them, and of course much more.
Note
This is available starting with Lizmap 2.11. For earlier versions, you must add your code directly to file lizmap/www/js/map.js.
In your repository (e.g.
/home/data/repo1/myproject.qgsyou should have these directories:media |-- js |-- myproject
All the Javascript code you copy in the
/home/data/rep1/media/js/myproject/directory will be executed by Lizmap, provided that:you allow it, through the Lizmap admin interface, adding the privilege « Allow themes for this repository » in the form for the modification of the repository
Évènements Javascript disponibles
Le code Javascript peut utiliser plusieurs événements déclenchés par Lizmap Web Client. Voici une liste de tous les événements disponibles, avec les propriétés retournées.
Nom de l’évènement |
Description |
Propriétés retournées |
|---|---|---|
treecreated |
Déclenché quand l’arbre de couche a été créé dans le panneau de légende |
|
mapcreated |
Déclenché quand la carte OpenLayers a été créé |
|
layersadded |
Déclenché quand les couches OpenLayers ont été ajoutées |
|
uicreated |
Déclenché quand l’interface a été déclenché |
|
dockopened |
Déclenché quand un dock est ouvert (panneau de gauche) |
id |
dockclosed |
Déclenché quand un dock est fermé (panneau de gauche) |
id |
minidockopened |
Déclenché quand un mini-dock (conteneur de droite pour les outils) est ouvert |
id |
minidockclosed |
Déclenché quand un mini-dock est fermé |
id |
bottomdockopened |
Déclenché quand le dock inférieur est ouvert |
id |
bottomdockclosed |
Déclenché quand le dock inférieur est fermé |
id |
lizmapbaselayerchanged |
Déclenché quand le fond de carte a été changé |
layer |
lizmapswitcheritemselected |
Déclenché quand une couche a été surlignée dans le panneau de légende |
name | type | selected |
layerstylechanged |
Déclenché quand le style d’une couche a été changé |
featureType |
lizmaplocatefeaturecanceled |
Déclenché quand l’utilisateur a désactivé l’outil de localisation par couche |
featureType |
lizmaplocatefeaturechanged |
Déclenché quand l’utilisateur a sélectionné un élément dans l’outil de localisation par couche |
featureType | featureId |
lizmappopupdisplayed |
Déclenché quand le contenu de la popup est affichée |
|
lizmappopupdisplayed_inattributetable |
Déclenché quand le contenu de la popup est affichée dans la table d’attribut (panneau en bas à droite) |
|
lizmapeditionformdisplayed |
Déclenché quand un formulaire d’édition est affiché |
layerId | featureId | editionConfig |
lizmapeditionfeaturecreated |
Déclenché quand une entité de couche a été créée avec l’outil d’édition |
layerId |
lizmapeditionfeaturemodified |
Déclenché quand une entité de couche a été modifiée avec l’outil d’édition |
layerId |
lizmapeditionfeaturedeleted |
Déclenché quand une entité de couche a été supprimée avec l’outil d’édition |
layerId | featureId |
attributeLayersReady |
Lancé lorsque toutes les couches à afficher dans l’outil Table attributaire ont été définis |
layers |
attributeLayerContentReady |
Lancé lorsqu’une table pour une couche a été affichée dans le dock inférieur |
featureType |
layerfeaturehighlighted |
Lancé lorsqu’un objet géographique a été mis en surbrillance dans la table attributaire (rectangle gris). Le déclenchement manuel de cet événement force l’actualisation des tables enfants s’il en existe pour la couche |
sourceTable | featureType | fid |
layerfeatureselected |
Lancez cet événement pour déclencher la sélection d’un objet géographique pour une couche, en transmettant l’identifiant de l’entité. Une fois la sélection effectuée, l’événement layerSelectionChanged est renvoyé en retour. |
featureType | fid | updateDrawing |
layerfeaturefilterselected |
Lancez cet événement pour déclencher le filtrage d’une couche pour les entités sélectionnées. Vous devez sélectionner des objets géographiques avant de déclencher cet événement. Une fois le filtre appliqué, Lizmap déclenche l’événement layerFilteredFeaturesChanged en retour. |
featureType |
layerFilteredFeaturesChanged |
Lancé lorsqu’un filtre a été appliqué à la carte pour une couche. Cet événement déclenche également le redessin de la carte et du contenu des tables attributaires. |
featureType | featureIds | updateDrawing |
layerFilterParamChanged |
Lancé lorsque les paramètres des requêtes WMS ont changé pour une couche. Par exemple quand un STYLE ou un FILTER a été modifié pour la couche. |
featureType | filter | updateDrawing |
layerfeatureremovefilter |
Lancez cet événement pour supprimer tous les filtres appliqués à la carte. Une fois cela fait, l’événement layerFilteredFeaturesChanged est renvoyé et le contenu de la carte et le contenu des tables d’attributs sont actualisés. |
featureType |
layerSelectionChanged |
Lancé lorsque la sélection a été modifiée pour une couche. Cela déclenche également la redéfinition du contenu de la table attributaire et du contenu de la carte |
featureType | featureIds | updateDrawing |
layerfeatureselectsearched |
Lancez cet événement pour sélectionner tous les objets géogrpahiques correspondant aux lignes affichées dans la table attributaire, qui peuvent être filtrées visuellement par l’utilisateur en entrant du texte dans le champs de saisie de recherche. |
featureType | updateDrawing |
layerfeatureunselectall |
Lancez cet événement pour supprimer toutes les objets géographiques de la sélection pour une couche. Une fois cela fait, Lizmap répond avec l’événement layerSelectionChanged |
featureType | updateDrawing |
lizmapexternalsearchitemselected |
Fired when the user has selected an item listed in the results of the header search input |
entité |
Certaines variables sont également disponibles.
Nom de la variable |
Description |
|---|---|
lizUrls.media |
URL pour pointer sur un media |
lizUrls.params.repository |
Nom du répertoire actuel |
lizUrls.params.project |
Nom du projet en cours |
Exemples
Here is a very small example allowing you to disable right clic in Lizmap. Just add a file named e.g. disableRightClick.js with the following code:
lizMap.events.on({
   uicreated: function(e) {
      $('body').attr('oncontextmenu', 'return false;');
   }
});
If you want this code to be executed for all projects of your repository, you have to copy the file in the directory
/home/data/rep1/media/js/default/rather than in/home/data/rep1/media/js/myproject/.
Here is a very useful example allowing you to send current login User-ID (and/or other user data) to PostgreSQL table column, using edition tool.
var formPrefix = 'jforms_view_edition';

// Name of the QGIS vector layer fields which must contain the user info
var userFields = {
   login: 'lizmap_user_login',
   firstname: 'lizmap_user_firstname',
   lastname: 'lizmap_user_lastname',
   organization: 'lizmap_user_organization'
};


lizMap.events.on({

   'lizmapeditionformdisplayed': function(e){

      // If user is logged in
      if( $('#info-user-login').length ){
            // Loop through the needed fields
            for( var f in userFields ){
               // If the user has some data for this property
               if( $('#info-user-' + f).text() ){
                  // If the field exists in the form
                  var fi = $('#' + formPrefix + '_' + userFields[f]);
                  if( fi.length ){
                        // Set val from lizmap user data
                        fi.val( $('#info-user-' + f).text() )
                        // Set disabled
                        fi.hide();
                  }
               }
            }
      }

   }

});
In the directory lizmap-web-client/lizmap/install/qgis/media/js/ you can find examples of suitable JavaScript code; just remove the extension .example and copy them to your media/js/default/ folder to activate them. You can also find some examples in the repository https://github.com/3liz/lizmap-javascript-scripts
If you want to get the URL of a static file.
var mediaUrl = OpenLayers.Util.urlAppend(
     lizUrls.media,
     OpenLayers.Util.getParameterString({
         "repository": lizUrls.params.repository,
         "project": lizUrls.params.project,
         "path": "picture.png"
     })
);
Printing configuration
To add print capabilities in the online map, you have to enbale the printing tool in the plugin Map tab (Configure the map) and the QGIS project has at least one print composition.
The print composition must contain at least one map.
you can add :
an image to North arrow
an image for the logo of your organization
a legend that will be fixed for all printing (before version 2.6)
a scale, preferably digital for display
a location map, a map for which you have enabled and configured the function of Overview
labels
You can allow the user to modify the contents of certain labels (title, description, comment, etc). To do this you need to add a identifier to your label in the composer. Lizmap will automatically ask you in the webbrowser to fill each fields. If your label is pre-populated in QGIS, the field will be pre-populated too in the webbrowser. If you check “Render as HTML” for your label in QGIS, you will have a multiline label in Lizmap.
Finally the print function will be based on the map scales that you set in the plugin Map (Configure the map).
Note
It is possible to exclude printing compositions for the web. For example, if the QGIS project contains 4 compositions, the project administrator can exclude 2 compositions in the QGIS project properties, OWS server tab. So only the published compositions will be presented in Lizmap.
Permettre l’impression de fond externe
The Lizmap plugin Baselayers tab allows you to select and add external baselayers (Configure the base layers). These external baselayers are not part of the QGIS project, default print function does not integrate them.
To overcome this lack Lizmap offers an easy way to print a group or layer instead of the external baselayer.
To add to printing a layer that replaces an external baselayer, simply add to the QGIS project a group or layer whose name is part of the following list:
osm-mapnik for OpenStreetMap
osm-mapquest for MapQuest OSM
osm-cyclemap for OSM CycleMap
google-satellite for Google Satellite
google-hybrid for Google Hybrid
google-terrain for Google Terrain
google-street for Google Streets
bing-road for Bing Road
bing-aerial for Bing Aerial
bing-hybrid for Bing Hybrid
ign-scan for IGN Scan
ign-plan for IGN Plan
ign-photo for IGN Photos
and then add your layer(s) you want to print as base.
Note
L’utilisation de cette méthode doit se faire dans le respect des licences des fonds externes utilisés (Configure the base layers).
For OpenStreetMap baselayers, it is possible to use an XML file for GDAL to exploit the OpenStreetMap tile services. Its use is described in the GDAL documentation http://www.gdal.org/frmt_wms.html or in this blog post http://www.3liz.com/blog/rldhont/index.php?post/2012/07/17/OpenStreetMap-Tiles-in-QGIS (beware, EPSG code should be 3857).
By cons, if this layer has to replace an external baselayer, it must be accessible to QGIS-Server but should not be accessible to the user in Lizmap Web Client. So it must be hidden. See chapter Masquer certaines couches.
Optimizing Lizmap
Concepts généraux
Rendering speed is crucial for a webGIS, much more so than for a desktop application:
les internautes s’attendent à ce que tout soit disponible presque immédiatement
each user can sends requests to the same application; if you have tens or hundreds of users, you can easy understand that optimising your web application is an important task.
You have to think to a web publication for many users rather than the display of a map to a single user.
By default, for each QGIS layer you add to your Lizmap project, you can choose from the Lizmap plugin whether to toggle the layer visibility on (checkbox Toggled?) at the startup of the application. You have to be careful not to abuse this feature, because if the project contains e.g. 30 layers, Lizmap at startup will send a request to QGIS server for each of them. If the checkbox Single Tile? is ticked, this will request 30 images of the size of your browser window. If not, Lizmap, through OpenLayers, will request 30 series of tiles (about 250 by 250 pixel). Each tile is an image, and is created as a function of the total window size and zooming level. Therefore, subsequent users will zoom in the same area, the tiles already generated will be reused. The tiles can be cached with two non exclusive systems:
server side, on the machine where QGIS server and Lizmap are installed. If the tile has been requested and generated earlier, and not expired, Lizmap will reuse it and send it to the client, avoiding a new request to QGIS server
client side: the tiles will be saved in the browser cache, and reused until they expire. This avoid both the request to QGIS server and the internet traffic.
The server cache has to be generated. In Lizmap <3, the only way of creating the tiles is to zoom and pan the whole map, and wait until all the tiles have been displayed. This is obviously impractical for projects covering a large area, with many zoom levels. in Lizmap >=3 we have developed a command line tool to generate all the tiles, or a selection of them.
Afin d’optimiser les performances, il est donc important de comprendre comme Lizmap utilise les tuiles a afficher.
Let’s say you have a screen of 1280 by 768 pixels. If you have all your layers tiled, Lizmap has therefore to show about 5 by 3= 15 tiles (256 by 256 pixel each) per layer, and more for a larger screen, now common. If surrounding tiles are only partially shown, the total number will be even greater. An average of 20 tiles per layer is a reasonable estimate. With 30 layers, as in our example, this will mean a total of about 20 by 30= 600 tiles (therefore, 600 requests to Lizmap server) per user, at each startup of Lizmap and for every zoom & pan. If you have 10 concurrent users, this gets quite heavy for the server, if the cache has not been generated previously, and QGIS server has therefore to create them. The time required for each tile will depend heavily on the performance of the server and the complexity of the project.
La taille de chaque tuile va dépendre de:
le type de données (raster ou vecteur simple, ou combinaison de plusieurs couches)
le format d’image choisi (PNG, JPEG)
A typical tile could be around 30 Kb. In our example, the client will therefore download about 20 by 30= 600 Kb per layer, which, for 30 layers, will give a grand total of about 18 Mb, which is heavy both for the server (lots of connection bandwidth consumed) and for the users (long delay, even with a reasonably fast connection).
Ces calculs montrent clairement que pour obtenir de bonnes performances en webmapping, vous devez faire des choix et simplifier autant que possible.
Si l’on regarde, par exemple, l’approche adoptée par Google Maps ou des services similaires, il est évident que, outre des serveurs puissants, ils ont simplifié le plus possible : une seule série de tuiles comme couche de fond, et très peu de couches (et pas toutes en même temps). Même si vous ne pouvez pas créer une carte aussi simple, il est important de savoir quelles couches doivent absolument être affichées au premier affichage de la carte et quels compromis sont acceptables pour vos utilisateurs.
Si votre projet a 50 couches à activer et désactiver, la grande majorité de vos utilisateurs ne sélectionneront jamais la plupart d’entre elles. Bien sûr, il existe des cas d’utilisation réels où des couches individuelles doivent être affichées de façon sélective, et il n’est donc pas possible de les regrouper pour réduire le nombre de couches affichées.
Pour optimiser votre application autant que possible, nous vous proposons de :
Créez des projets QGIS distincts, et donc des cartes Lizmap différentes, pour différents objectifs, regroupant ainsi les données dans des thèmes logiques. Par exemple, une carte sur le développement urbain avec peut-être 10 couches et une sur l’environnement, avec environ 5 couches, est généralement plus lisible, et beaucoup plus rapide, qu’un seul projet complexe avec toutes les données. L’ajout d’une petite image pour chaque projet aidera les utilisateurs à sélectionner le projet pertinent à première vue. Vous pouvez également partager certaines couches entre différents projets, via le mécanisme d’intégration dans QGIS.
Use the option Maps only in the administrator web interface. This option allows the user to switch automatically from one map to another, through the button Home, maintaining as much as possible the localization and the zooming level. In this case, the Lizmap welcome page with the list of projects and their thumbnails is not displayed, and the user is directed automatically to one of the projects, at the administrator choice.
Do not show all the layers at startup (deactivate the checkbox Toggled? as described above). Only very important layers should be visible by default, and users should activate only the layer they need. This allow a sensible reduction in the number of requests, and of the total network traffic.
Create groups of layers, and use the option Group as layer? in Lizmap plugin. Generally a series of layers of the same general theme can be displayed as a whole, with an appropriate choice of styles. In this case, Lizmap will only show one checkbox for the whole group, and more importantly it will request only one series of tiles for the whole group, thus reducing the number of tiles and server requests, and the total volume of data to be downloaded. The legend of the group will be displayed.
Use the option Single Tile? for some layers. In this case, Lizmap will request only one image per layer, of about the size of the screen, instead of a series of tiles. This will therefore greatly reduce the number of requests to the server. For instance, in our example above, without the optimizations described, if all the layers are displayed, every user will request 30 images (one per layer) for every zoom or pan, instead of 480. The total size of data to be downloaded is however similar. On the other hand, different users will be very unlikely to request exactly the same image, therefore using a cache is pointless in this case, and is avoided by Lizmap (the two options are mutually exclusive). The optimal choice (single tile vs. tiled) is different for different layers. For instance, a complex base layer, created by combining 15 individual layers, will be best used as a group (Group as layer?), tiled and cached. A simple linear layer, like a series of bus lines, can be displayed as a single tile.
Use the option Hide checkboxes for groups: this avoids the users to click on a group with e.g. 20 layers without really needing it, thus firing a big series of requests to the server. In any case, avoiding groups of more than 5-10 layers is usually good practice.
Optimiser les données et le projet QGIS, Comme mentionné ci-dessus, publier une carte sur internet va changer votre point de vue : comme dit précédemment, vous devez avoir à l’esprit que de nombreux utilisateurs peuvent requêter votre serveur en même temps, et donc afin d’éviter une surcharge il est crucial de :
créer un index spatial pour toutes vos couches vectorielles
faire une pyramide de toutes vos couches rasters (sauf les très petites)
n’afficher les données qu’à l’échelle appropriée : par exemple, afficher la couche détaillé d’un bâtiment à l’échelle 1:500 000 n’a pas d’intérêt, puisque l’image est quasi illisible, et surcharge fortement le serveur
use simplified version of a layer to display it at different scales. You can then group the original layer (to be displayed e.g. around 1:1,000) with the simplified versions (to be displayed e.g. around 1:10,000, 1:50,000, etc.), and Goup as a layer to let the user see this as a single layer, using the most appropriate data at each scale
faire attention à la reprojection “à la volée” (ALV). Si, par exemple, vous affichez des données en Lambert 93 (EPSG:2154) sur un fond de carte OpenStreetmap ou Google (en Pseudo Mercator, EPSG:3857), QGIS Server nécessite de reprojeter les couches rasters et vectorielles avant de générer la carte. Ceci peut impacter le temps du rendu pour les couches grandes et complexes. En France, vous pouvez éviter la reprojection en utilisant les fonds de carte du Géoportail IGN directement en EPSG:2154
d’être attentif au fait que certaines options de rendu ( par exemples les labels, les expressions, etc.) peuvent demander beaucoup de ressources au serveur
si vous utilisez PostGIS, optimisez le : créer toujours un index spatial, des indexes pour les données filtrées et pour les clés étrangères, utilisez les paramètres appropriées pour la configuration PostgreSQL, si possible une connexion par socket UNIX plutôt qu’en TCP/IP (pour ceci utilisez des services), etc.
use an appropriate image format. For the base layers, where you do not need transparency JPEG is usually the best option: the tiles will be smaller, and faster to download. For other layers, try smaller depth PNGs (16bit or 8bit): for some symbolizations, the visual result may be the same, and the tiles smaller. Have a check to see if the image quality is acceptable in your case
Améliorer votre serveur. C’est peut être utile mais c’est sans intérêt si vous n’optimisez pas votre projet comme expliquez ci-dessus. Dans tout les cas, un serveur avec peu de ressources (par exemple 2 Gb RAM, 2 cœurs à 2,2 GHz) ne sera pas suffisant. Le minimum raisonnable est un quad-core rapide avec 8Gb RAM. Évitez d’installer QGIS Server et Lizmap sur Windows, c’est plus compliqué et plus lent.
Note
In Lizmap 3 you’ll find several improvements that will help optimizing your installation:: * a tool for the preparation of the server cache, through the use of a WMTS protocol. In addition, this will allow to use the cached layers as WMTS layers in QGIS desktop * avoiding the automatic download of the legends at startup, and at every zoom level; this will be done exclusively on demand, if the legend is displayed, thus saving one request per layer for each zoom * code optimization.
En détail : comment activer les différents caches
The Lizmap plugin Layers tab allows you to enable for each layer or group as a layer the cache for generated images. This feature is not compatible with the option not tiled image.
Activating the cache server side
Lizmap Web Client can dynamically create a cache tiles on the server. This cache is the storage of the images already generated by QGIS-Server on the server. The Lizmap Web Client application automatically generates the cache as the tiles are requested. Enable caching can greatly lighten the load on the server, since we do not want more QGIS-Server tiles that have already been made.
To activate it you must:
check the box Server cache?
specify the expiration time of the cache server in seconds: Expiration (seconds)
The Metatile option allows you to specify image size in addition for generating a tile. The principle of Metatile is to request the server for a bigger image than hoped, to cut it to the size of the request and return it to the Web client. This method avoids truncated labels at the edges and discontinuities between tiles, but is more resource intensive. The default value is 5,5, an image whose width and height are equal to 5 times the width and height request. This option is useless for rasters.
Activating the cache client side
The Browser client cache option allows you to specify an expiration time for the tiles in the Web browser (Mozilla Firefox, Chrome, Internet Explorer, Opera, etc.) cache in seconds. When browsing the Lizmap map with the browser, it stores displayed tiles in its cache. Enable client cache can greatly optimize Lizmap because the browser does not re-request the server for tiles already in cache that are not expired. Values 0,0 and 1,1 are equivalent, and do not activate the option.
Nous conseillons de mettre la valeur maximale (1 mois soit 24 x 3600 x 30 = 2592000 secondes), sauf bien sûr pour les couches dont la donnée change souvent.
Note
Le cache doit être activé seulement une fois le rendu bien maîtrisé, lorsqu’on souhaite passer le projet en production.
The 2 cache modes, Server and Client, are completely independent of one another. But of course, it is interesting to use the two together to optimize the application and free server resources.
Centraliser le cache via l’intégration de groupes et couches d’un projet parent
In QGIS, it is possible to integrate in a project, groups or layers from another project (which will be called « parent »). This technique is interesting because it allows you to set the properties of the layers once in a project and use them in several other, for example for baselayers (In the « son » projects that integrate these layers, it is not possible to change the properties).
Lizmap uses this feature to centralize the tiles cache. For all son projects using integrated layers of the parent project, Lizmap requests QGIS-Server tiles from the parent project, not form son projects. The cache will be centralized at the parent project, and all son projects that use layers benefit shared cache.
Pour pouvoir utiliser cette fonctionnalité, il faut
publier le projet QGIS parent avec Lizmap
you must choose the right announced extent in the OWS Server tab from project properties, because this extent will be reused identically in son projects.
you must configure the cache for the layers to integrate. Also, note the options chosen here (image format, metatile, expiration) for use as such in the son projects.
It is possible to hide the project from the main page of Lizmap with the check box Hide the project Web Client Lizmap in the plugin “Map” tab.
open the son project, and integrate layers or groups in this project, for example orthophoto. Then you must:
verify that the announced extent in the QGIS project properties / OWS Server is exactely the same as the parent project.
il faut configurer le cache pour la couche intégrée avec exactement les mêmes options que celles choisies dans le projet parent : format d’image, expiration, metatile
il faut renseigner l’identifiant Lizmap du Répertoire source du projet parent (celui configuré dans l’interface d’administration de Lizmap-Web-Client)
the code of the « Source project » (the name of the parent QGIS project without the .qgs extension) is automatically entered for layers and integrated groups.
Publish the son project to the Lizmap Web Client as usual.
Masquer certaines couches
You can exclude layers of your publication with the OWS Server tab of the QGIS project properties. In this case the layers will not be available in Lizmap. With this method, you cannot use a layer in the locate by layer function and not display in the map.
To overcome this lack Lizmap offers a simple way to not display some layers.
Not to display one or more layers of QGIS project in the legend of the Web map, just put these layers in a group called « hidden ». All the layers in this group will not be visible in the Web application.
Cette fonctionnalité peut servir pour :
cacher une couche utilisée dans la fonction de localisation (Add the localization function)
masquer une couche simple d’ajout de données rendu à l’aide d’une vue
masquer une couche pour l’impression de plan (Permettre l’impression de fond externe)
Show attribute table for Lizmap layers
Principe
Lizmap is designed to show spatial data in the main map, and you can propose users to see an object data through the « popup » feature (a small popup containing the objects data is shown whenever the user clicks on the map ). See How to configure popups
Sometimes this is not enough, and as a map editor, you would like the user to see all the data of a specific layer, as you can do in QGIS by opening the attribute table. Since Lizmap 2.11, you can propose such a feature for any vector layer published in you map. (This feature has been heavily enhanced since Lizmap 3.0. Many features described underneath are only available for Lizmap 3.0 )
Activate the attribute table tool for a vector layer
Dans l’onglet Outils de la boîte de dialogue du plugin Lizmap, il y a un groupe nommé « Table attributaire » qui contient un tableau et des champs de formulaire permettant l’ajout et la suppression de couches vectorielles.
Lizmap Web Client uses the Web Feature Service (WFS) to get data from a QGIS vector layer and display it in the web interface. This is why the first thing to do whenever you want to show a layer data in the web client is to publish the vector layer through the WFS. To do so, open the Project properties dialog, got the the OWS Server tab, and add the layer as « published » by checking the corresponding checkbox in the Web Feature Service table, and save the project. You can also tune the number of decimals to decrease the size of data to be fetched from WFS ( keep 8 only for a map published in degrees, and keep 1 for map projections in meters )
Once the layer is published through WFS, you can add it in the attribute layers table. Some options are available to finely tune the features provided to the user:
Couche : Choisissez une des couches vectorielles (spatiale ou non). Cela peut être n’importe quel format de couche vectorielle : GeoJSON, Shapefile, PostGIS, CSV, etc.
Identifiant unique : L’outil table attributaire nécessite de définir chaque objet comme unique. Nous vous recommandons fortement d’ajouter un champ avec des valeurs uniques si votre couche n’en possède pas encore. En général le champ avec valeur unique contient des entiers. Si la couche ne possède pas ce type de champs, vous pouvez aisément le créer avec la Calculatrice de champ. Choisissez le champ qui convient avec la liste déroulante.
Champs à masquer : Il existe 2 façons de masquer des champs dans la table attributaire publiée.
Dans la boîte de dialogue Propriétés de la couche de la couche vectorielle dans QGIS, dans l’onglet Champs, vous pouvez décocher la case de la colonne WFS pour les champs à ne pas publier. Ceci signifie que ces champs ne seront pas publiés via le protocol WFS. C’est la façon la plus simple et la plus sûre de restreindre la publication de certains champs (pour interdire l’accès à des données sensibles par exemple)
Vous pouvez utiliser l’option Champs à masquer pour masquer les champs données dans la table attributaire. Les champs masqués seront invisibles pour l’utilisateur final, mais toujours disponible pour Lizmap Web Cleint. Vous devez utiliser cette option pour masquer le champ avec des valeurs uniques. Si vous utilisez la première méthode (décocher la colonne WFS), l’identifiant unique ne sera pas utilisable par Lizmap, et certaines fonctionnalités de la table attributaire ne fonctionneront pas correctement.
Using relations with the attribute layers tool
Dans QGIS, vous pouvez configurer des relations entre des couches, dans la boîte de dialogue Propriétés du projet. Si vous publiez dans Lizmap plus d’une couche dans l’outil table attributaire, et si des couches ont une relation, les utilisateurs finaux pourront voir les tables enfants en-dessous leur table parent, et un clic sur une ligne dans la table parent déclenchera le filtre sur le contenu des tables enfants.
Par exemple, vous pourriez avoir une couche avec des villes, et une couche enfant avec des bâtiments publics. Cliquer sur une ville dans la table attributaire déclenchera le rafraichissement du contenu de la table enfant des bâtiments publics présentant uniquement ceux de la ville cliquée.
Vous pouvez utiliser des relations « plusieurs-à-plusieurs » (N:M) dans QGIS depuis la version 2.14 mais à ce jour Lizmap ne les utilisent pas automatiquement. Vous devez aussi définir les relations dans le plugin Lizmap. Dans de nombreux cas, les relations N:M sont très pratiques. Par exemple, vous pouvez avoir les trois couches vectorielles suivantes dans votre projet :
Lignes de tramway : cette couche nommée « Lignes » contient une objet par ligne de tram, avec un champ à identifiant unique nommé tram_id
Arrêts de tramway : cette couche nommée « Arrêts » contient une objet par arrêt de tram, avec un champ à identifiant unique nommé stop_id
Table de correspondance entre les lignes et les arrêts : cette couche nommée « Pivot » est une table pivot entre les lignes et les arrêts de tram, puisque un arrêt peut être pour plus d’une ligne, et une ligne dessert plusieurs arrêts. Elle contient les champs suivant : tram_id, stop_id et order ce dernier définissant l’ordre de l’arrêt sur la ligne.
Vous pouvez définir 2 relations dans les propriétés du projet QGIS : une entre Lignes et Pivot utilisant le champ tram_id, et une entre Arrêts et Pivot utilisant le champ stop_id.
Dans Lizmap, nous avons ajouté un moyen simple de configurer une relation N:M. Vous pouvez simplement
Créer les deux relation décrites ci-dessus dans la boite de dialogue des propriétés du projet QGIS, onglet Relations
Ajoutez les couches Lignes et Arrêts dans l’outil de table attributaire
Ajoutez la couche Pivot dans l’outil de table attributaire avec l’option Table pivot ? cochée
Lizmap Web Client gérera ensuite la relation comme une relation N:M
La table pivot sera affichée sous chaque table attributaire parent et affichera uniquement les enfants correspondant.
La fonction de filtre basée sur l’attribut des couches déclenchera les filtres en cascade sur le pivot et les autres parents. Par exemple, si l’utilisateur utilise le filtre pour n’afficher qu’une ligne de tramway, Lizmap n’affichera aussi que les arrêts correspondants sur la carte et dans la table attributaire pour Arrêts.
Attribute table and edition
todo
Editing data in Lizmap
Principe
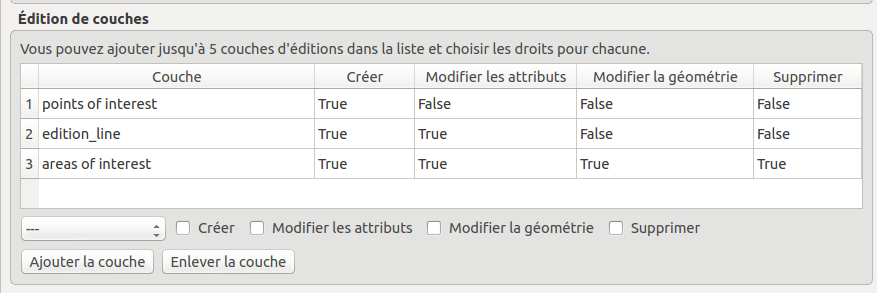
Since version 2.8, it is possible to allow users to edit spatial and attribute data from the Lizmap Web Client interface for PostgreSQL or Spatialite layers of the QGIS project. The Lizmap plugin allows you to add one or more layers and choose what actions for each will be possible in the web interface:
création d’élements
modification des attributs
modification de la géométrie
suppression d’éléments
Le formulaire web présenté à l’utilisateur pour renseigner la table attributaire prend en charge les Outils d’éditions proposés dans l’onglet Champs des propriétés de la couche vectorielle QGIS. On peut donc configurer une liste déroulante, masquer une colonne, la rendre non-éditable, utiliser une case à cocher, un champ texte, etc. Toute la configuration se fait à la souris, dans QGIS et dans le plugin Lizmap.
De plus, Lizmap Web Client détecte automatiquement le type de colonne (entier, réel, chaîne de caractère, etc.) et ajoute les vérifications et les contrôles nécessaires sur les champs.
Usage examples
Une commune souhaite permettre aux citoyens de recenser les problèmes visibles sur la voirie: poubelles non ramassées, lampadaires en panne, épaves à enlever. L’administrateur du projet QGIS crée une couche dédiée à ce recueil de données et affiche à tous la donnée.
Un bureau d’étude souhaite permettre aux partenaires d’un projet de remonter des remarques sur des zones du projet. Il permet l’ajout de polygones dans une couche dédiée.
Configuring the edition tool
Pour permettre l’édition de données dans Lizmap Web Client, il faut
At least one vector layer with PostGIS or Spatialite type in the QGIS project.
Configure editing tools for this layer in the fields tab of the layer properties. This is not required but recommended to control the data entered by users.
Add the layer in the tool with the plugin
Voici le détail des étapes:
Si nécessaire, créer une couche dans votre base de données, du type de géométrie souhaité (point, ligne, polygone, etc.)
pensez à ajouter une clé primaire : c’est indispensable !
cette colonne de clé primaire doit être de type auto-incrémenté. Par exemple serial pour PostGresql.
pensez à ajouter un index spatial : c’est important pour les performances
créer autant de champs dont vous avez besoin pour les attributs : utiliser si possible des noms de champ simples !
Please refer to the QGIS documentation to see how to create a spatial layer in a PostGIS or Spatialite database: http://docs.qgis.org/html/en/docs/user_manual/index.html
Set the editing tools for your layer fields
Open the layer properties by double-clicking on the layer name in the legend.
Go to Fields tab.
Select the Editing tool in the Edit widget column for each field of the layer:
To hide a field, choose Hidden. The user will not see the field in the form. There will be no content inserting. Use it for the primary key.
To add a read-only field, unchecked Editable checkbox.
Special case of the option Value Relation. You can use this option for a Lizmap map. For users to have access to information of the outer layer that contains the data, you must enable the publication of the layer as a WFS layer in the OWS Server tab of the QGIS project properties.
etc.
QGIS 2 evolutions:
To hide columns in the Lizmap popup, you must now uncheck the box in the WMS for each field to hide (this column is just after Alias)
Lizmap Web Client does not know the « QT Designer UI file » for form generation. Therefore only use the Autogenerate mode or Drag and drop mode for editing layers.
Note
All the editing tools are not yet managed by Lizmap Web Client. Only the following tools are supported: Text edit, Classification, Range, Value Map, Hidden, Check Box, Date/Time, Value Relation, Relation Reference. If the tool is not supported, the web form displays a text input field.
Note
To make the field compulsory you have to define it as NOT NULL in the properties of the table, at the database level.
Note
Faites attention si votre couche contient des valeurs Z ou M, actuellement Lizmap les définira à « 0 » qui est la valeur par défaut à l’enregistrement dans la base de données.
Add the layer in the table « Layer Editing » located in the plugin Lizmap « Tools » tab:
Sélectionner la couche dans la liste déroulante
Cocher les actions que vous souhaitez activer parmi:
Create
Modify attributes
Modify geometry
Delete
Add the layer in the list with the « Add layer » button.
Réutiliser les données des couches d’édition
Les couches que vous avez sélectionnées pour l’outil d’édition sont des « couches comme les autres », ce qui implique:
Les styles et les étiquettes de QGIS s’appliquent sur ces couches. On peut donc créer des styles et des étiquettes qui dépendent d’une valeur d’une des colonnes de la couche.
Si on souhaite proposer l’outil d’édition, mais ne pas permettre aux utilisateurs de voir les données de la couche en ligne ( et donc les ajouts des autres utilisateurs) : on peut simplement masquer la ou les couches d’édition en les mettant dans un répertoire hidden. Voir Masquer certaines couches
Les couches sont imprimables si elles ne sont pas masquées.
Les données sont enregistrées dans une couche du projet. L’administrateur peut donc récupérer ces données et les utiliser par la suite.
Note
Pour bien centraliser les choses, nous conseillons d’utiliser une base de données PostGIS pour stocker les données. Pour les couches Spatialite, il faut faire attention à ne pas écraser le fichier Spatialite stocké dans le répertoire Lizmap sur le serveur par celui que vous avez en local: pensez à toujours faire une sauvegarde du fichier du serveur avant une nouvelle synchronisation de votre répertoire local.
Note
Utilisation du cache: Si vous souhaitez utiliser le cache serveur ou client pour les couches d’édition, faites-le en toute connaissance de cause : les données ne seront pas visibles par les utilisateurs tant que le cache ne sera pas expiré. Nous conseillons de ne pas activer le cache pour les couches d’édition
Note
Lizmap 3 only
Ajouter des images et des fichiers pour les attributs
Utiliser le dossier media/upload par rapport à un projet
With Lizmap 3, it is now possible to upload your files, including images, for each feature, during online editing; to achieve this, you need to:
Configure edition for the layer, with one or more fields with the edit type « Photo » or « File ». For example, let say the field name is « photo »
Create a folder at the root of the QGIS project file : media/ and a subfolder media/upload (obviously you need to do that locally in your computer and server side ).
Give webserver user (usually www-data) write permission on the upload folder, so that it can create files and folders in media/upload:
chmod 775 -R media/upload && chown :www-data -R media/upload
Check you
php.inito see if the variablespost_max_sizeandupload_max_filesizeare correctly set (by default, php only allows uploading files up to 2 Mbyte)
Lizmap will then create folders to store the data, depending on the layer name, field name, etc. For example, a file would be stored in the folder media/upload/PROJECT_NAME/LAYER_NAME/FIELD_NAME/FILE_NAME.EXT and an image in media/upload/environment/observations/species_picture/my_picture.png.
Bien sûr vous pourrez afficher l’image (ou tout autre fichier) dans la popup, puisqu’elle sera stockée dans le répertoire media, Voir Utilisation dans les popups
Utilisez un dossier de destination spécifique
Since Lizmap 3.2, you can override the default destination folder media/upload/PROJECT_NAME/LAYER_NAME/FIELD_NAME/FILE_NAME.EXT by manually setting the path where to store the media, relatively to the project. To do so, you must use the External resource field edit widget, and configure it with:
a Default path written relative to the project. For example
../media/images/if you want to store this field files in a folder media situated alongside the project folder. You can also choose set a path inside the project media folder. For examplemedia/my_target_folder/.chek the Relative path checkbox, with the default Relative to project path option
if the field should store a image, you should also check the Integrated document viewer checkbox, with the type Image
This allow to store the sent media files and images in a centralized folder, for example a directory media at the same level than the Lizmap repositories folders:
media
images <– to store images in this folder, use:
../media/images/pdf
environnement
trees.qgs
trees.qgs.cfg
media
tree_pictures/ <– to store images in this folder, use:
media/tree_pictures/
Filtered layers - Filtering data in function of users
Presentation of the function
Habituellement, la gestion des droits d’accès aux projets Lizmap se fait par répertoire. La configuration se fait dans ce cas via l’interface d’administration de Lizmap Web Client. Voir Définir les droits pour chaque groupe. Cela permet de masquer complètement certains projets en fonction des groupes d’utilisateurs, mais oblige une gestion par répertoire et projet.
Au contraire, la fonctionnalité de filtrage présentée ici permet de publier un seul projet QGIS, et de filtrer les données affichées sur la carte en fonction de l’utilisateur connecté. Il est possible de filtrer uniquement les couches vectorielles, car Lizmap se base sur une colonne de la table attributaire.
Le filtrage se base sur l’identifiant du groupe de l’utilisateur actuellement connecté à l’application Web. Il est actif pour toutes les requêtes vers le serveur QGIS, et concerne donc :
les images des couches vectorielles affichées sur la carte
the popups
les listes de la fonction Localiser par couche. Voir Add the localization function
drop-down lists of Editing forms from Value relation. See Editing data in Lizmap
les fonctionnalités à venir (affichage de la table attributaire, fonctions de recherche, etc.)
Un tutoriel vidéo est disponible à cette adresse : https://vimeo.com/83966790
Configuration of the data filter tool
Pour utiliser l’outil de filtrage des données dans Lizmap Web Client, il faut :
use QGIS 2 and above on the server
avoir accès à l’interface d’administration de Lizmap Web Client
Voici le détail des étapes pour configurer cette fonctionnalité :
Knowing the identifiers of user groups configured in the Lizmap Web Client adminstration interface. For this, you must go to the administration interface : ID appears in parentheses after the name of each group (under the title Groups of new users)
- For all vector layers which is desired filter data, just add a text column that will hold the group ID for each line (not the name !!) who has the right to display this line.
Fill this column for each line of the attribute table with the identifier of the group who has the right to see the line (using the calculator, for example).
It is possible to set all as the value in some lines to disable the filter: All users will see the data from these lines.
Si la valeur contenue dans cette colonne pour une ligne ne correspond pas à un des groupes d’utilisateurs, alors la donnée ne sera affichée pour aucun utilisateur.
Add the layer in the table Filter Data by User located in the plugin Lizmap Tools tab:
Select layer from the dropdown list
Select the field that contains the group identifier for the layer
Add the layer in the list with the button Add layer
To remove a layer of the table, click on it and click the button Delete the layer
Disable the client cache and cache server for all filtered layers. Otherwise, the data displayed will not be updated between each connection or user logout!
Time Manager - Animation of temporal vector layers
You can create animations of your vectors, provided you have at least a layer with a column with a valid date/time. You should select from the plugin:
at least one layer with the date/time
the column with the date/time
the number and type of time units for each step of the animation
the duration, in milliseconds, of each step (the default is to display each 10 days block for one second)
one field to display as a label when hovering with the mouse over the objects
optionally, an ID and a title for groups of objects.
When ready, your web application will display the symbol of a watch; clicking on it will open a small panel that will allow you to move between steps, or paly the entire animation. At startup, the application will load the entire table, so if you have thousands of objects you may need to wait for several seconds before the application is available.
Un tutoriel vidéo est disponible ici : https://vimeo.com/83845949. Il montre toutes les étapes pour utiliser cette fonctionnalité
Demonstration site: http://demo.lizmap.3liz.com/index.php/view/?repository=rep6
Note
Several different formats for date/time are acceptable (those supported by the JavaScript library DateJS). You can check whether your format is supported by entering it in this page: http://www.datejs.com/
Statictics with Dataviz
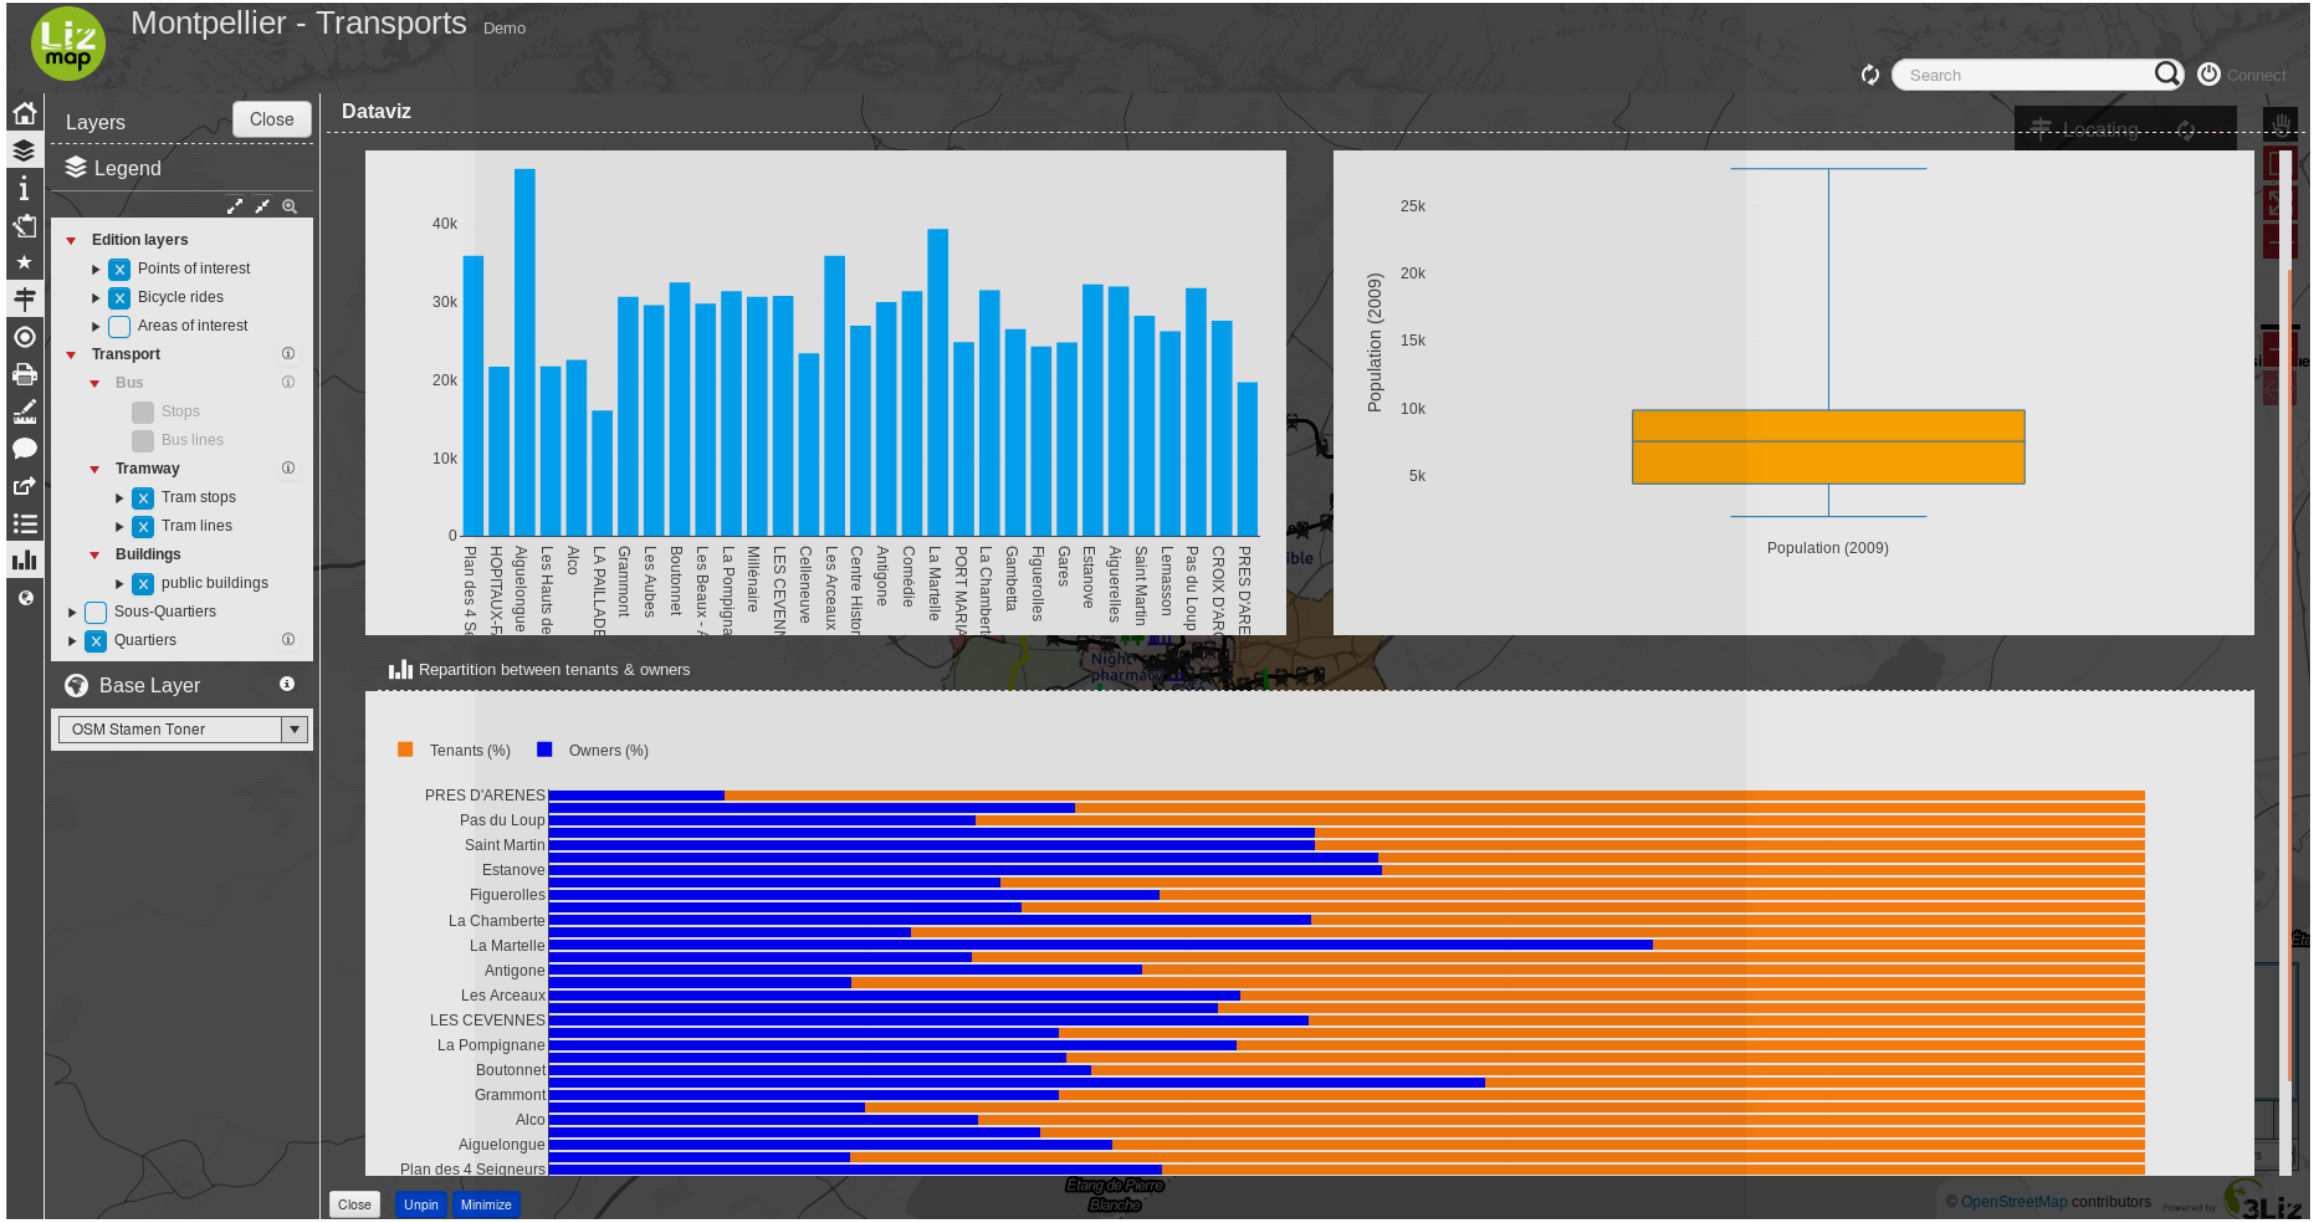
In the 3.2 version of Lizmap, a way to show charts in Lizmap is implemented. You will be able to create a few kinds of graph (scatter, pie, histogram, box, bar histogram2d, polar) with only a few clicks.
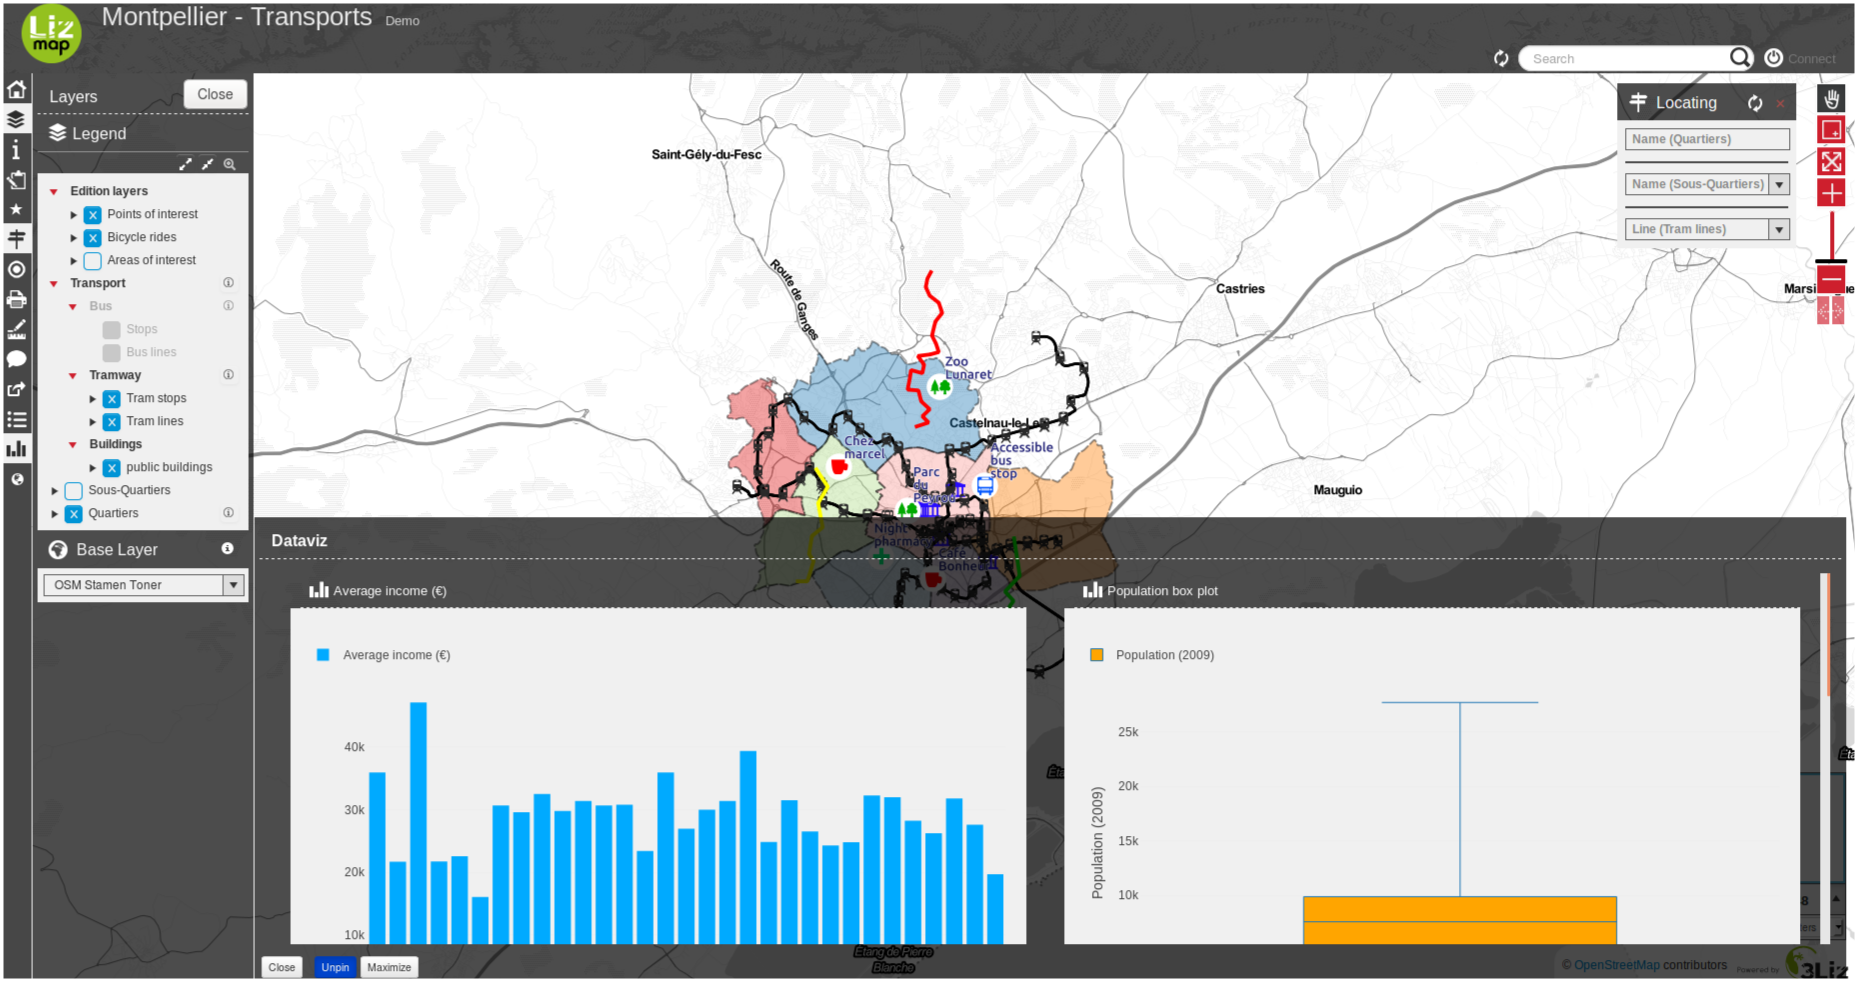
You can easily configure it with the plugin Lizmap in Qgis in the Dataviz panel.
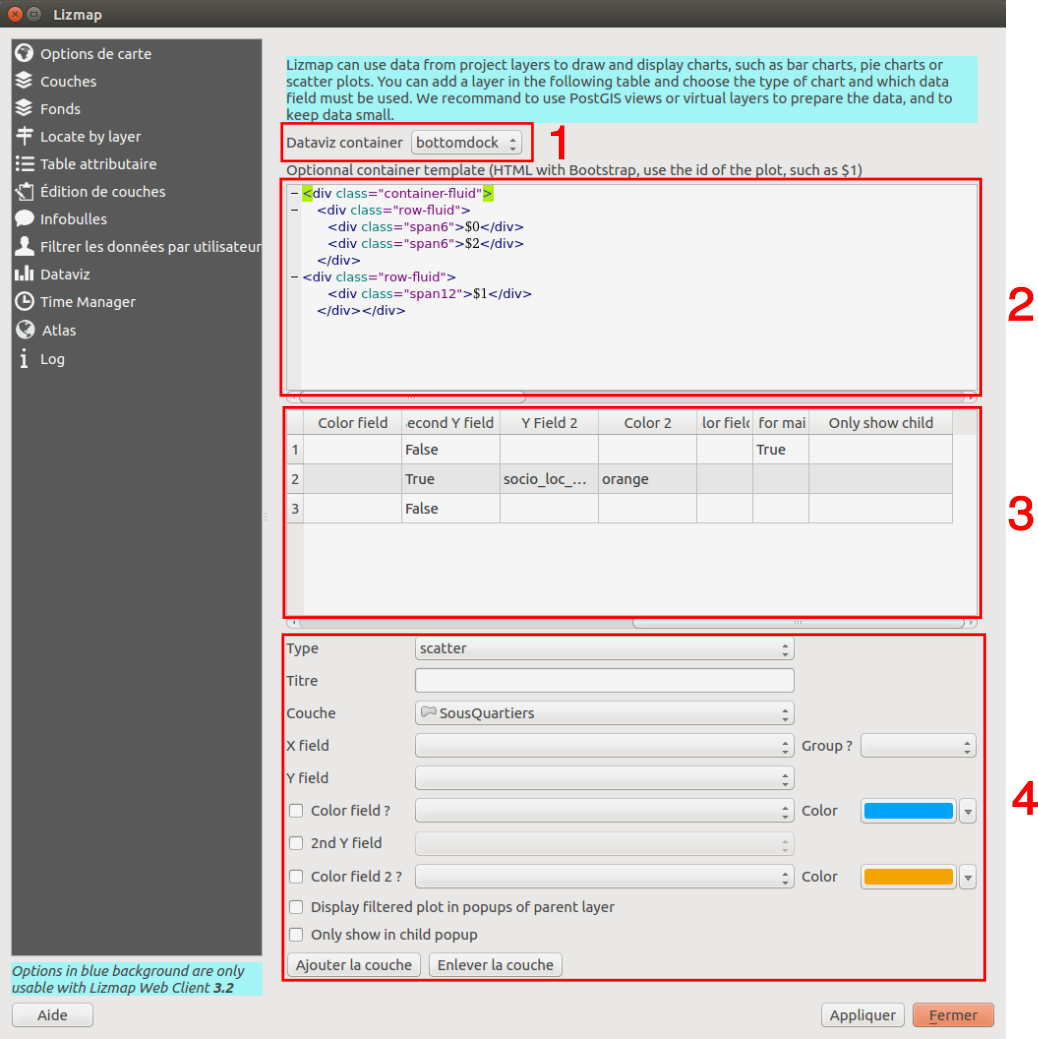
1 : You have the possibility to change the value to dock, bottomdock or right-dock these options change where your dataviz panel will be located in your Lizmap’s project. You have 3 positions available, at the right of the screen, bottom and right.
2: Here, you have the possibility to write in HTML to change the style of the container of your charts. If you are proficient in the HTML language, there are a lot of possibilities and you can customize your container the way you want.
3: This table contains all the layers you have configured to be able to show statistics in your Lizmap project. All details about the configuration are shown in this table. You have to use it if you want to remove a layer, you will need to click on a line of the table then click on the button remove a layer at the bottom on the panel.
4: To add a graph, you have to configure it in this part of the panel.
Type : You can choose the type of your graph, the available options are - scatter, box, bar, histogram, histogram2d, pie and polar.
Title : Here you can write the title you want for your graph.
Layer : You chose which layer you want to make a graph with.
X field : The X field of your graph.
Y field : The Y field of your graph.
Group? : For a few types of charts like “bar” or “pie”, you can chose to aggregate the data in the graph. There are a few aggregate functions available - average(avg), sum, count, median, stddev, min, max, first, last
Color field : you can choose or not a color field to customize the color of each category of your chart. If you want to do it, you need to check the checkbox, then chose the field of your layer which contains the colors you want to use. The color can be written like “red” or “blue” but it can be an HTML color code like “#01DFD7” for example.
2nd Y field : You can add a second Y field, it does not work for every type of graph, it’s only working for histogram2d.
Color field 2 ? : You can chose the color of the second Y field the same way you chose the one for his first Y field.
Display filtered plot in popups of parent layer : if you check this checkbox, the children of your layer will get the same graph as the parent plot but filtered only for them. It’s useful if you want to see the statistics of one entity instead of all.
Only show child : The main graph will not be shown in the main container and only the filtered graph of the relation of the layer will be displayed in the popup when you select the element.
When all the configuration is done, you have to click on the button add a layer at the bottom of the window.
Atlas - sequence of entities of a chosen layer
This feature let you chose and configure a layer to make her into an atlas in your Lizmap project.
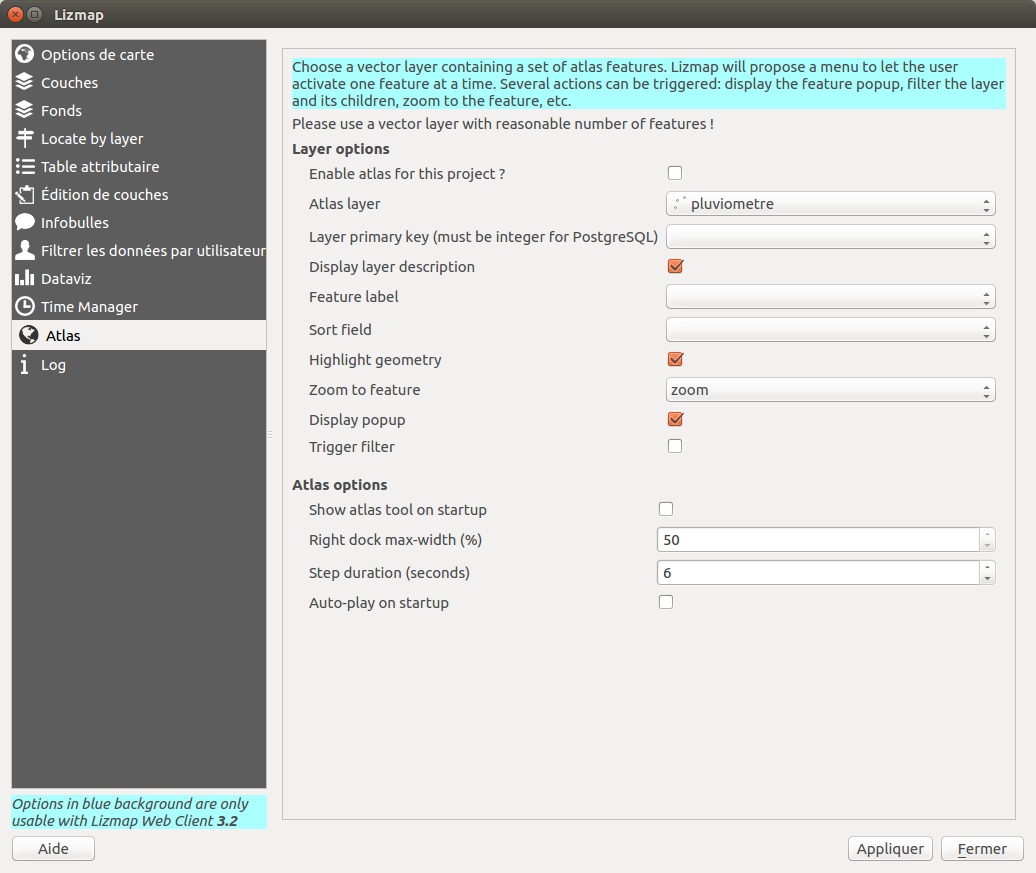
Layer options :
the atlas is enabled or not in your project
vous devez choisir la couche sur laquelle vous voulez réaliser votre atlas
sélectionnez le champ de clé primaire, ce doit être un entier
cochez si vous voulez afficher la description de la couche dans le dock de votre atlas
choisissez le champ qui contient le nom de vos entités, il sera affiché à la place de la clé primaire dans la liste des entités
votre atlas sera trié en fonction de ce champ
Vous pouvez choisir de mettre en surbrillance l’entité sélectionnée par l’atlas, elle changera chaque fois qu’elle passe à une nouvelle entité
Choisissez entre un zoom sur l’entité ou en faire le centre de votre carte
you can chose to display the popup in the feature in the atlas container or not
cochez si vous voulez activer le filtre sur l’entité sélectionnée par l’atlas, cela masquera toutes les autres entités de la couche et affichera uniquement celle sélectionnée
Atlas options:
Vérifiez si vous voulez ouvrir l’outil Atlas lorsque vous ouvrez votre projet
you can chose the size of the atlas dock (20%-50%)
you can select the duration between each step when your atlas is in auto-play mode
cochez si vous voulez lancer le mode de lecture automatique quand vous ouvrez le projet
Form filtering - Filter layer data based on field values
Presentation
This tool, available since Lizmap Web Client 3.3, displays a form in the left panel, based on some fields, and allow the users to search among the layer data with a variety of form inputs: combo boxes, checkboxes, text inputs with autocompletion, date selector with sliders between the min and max date, etc..
It works only for database layers: PostgreSQL (recommended), Spatialite and GeoPackage, since Lizmap should query the data to retrieve:
le nombre total des entités pour le filtre courant
les valeurs uniques de certains champs (pour le type Valeurs uniques par exemple)
le minimum et le maximum pour les champs numériques ou de date
l’emprise des données pour le filtre courant
Vous pouvez voir une vidéo avec un exemple : https://vimeo.com/331395259
Configuration
There is a new tab in the Lizmap plugin ( for QGIS 3 only) which lets you configure the filter inputs based on the layer fields. You can add one or more fields for one or more layer. If you add fields from 2 or more different layers, Lizmap Web Client will show a combo box to allow the user to choose the layer to filter. Selecting a layer will refresh the form and deactivate the current filter.
The layer must be published in the WFS capabilities group of the Project properties OWS Server tab.
Vous devez ajouter une ligne dans le tableau du plugin pour chaque champ souhaité dans le formulaire de filtre. Pour chaque champ vous devez configurer des options :
Layer: the source layer.* Title: the title to give to the input, which will be displayed above the form input. For example « Choose a category » for a layer field called « category »
Type: the type of the form input, among one of the following: Text, Unique Values, Date, Numeric
Champ : le nom du champ (dans la table en base données). Seulement pour les types Texte, Valeurs uniques et Nombre.
Min date: the field containing the start date of your object (ex: « start_date » of an event). This is only needed for the Date type. If you have only one date field in your data, you should select it in the Min Date field.
Max date: the field containing the end date of your data. If you have 2 fields containing dates, one for the start date and another for the end date, you can differentiate them. If not, you need to use the same field name for Min date and Max date.
Format: the format of the Unique values type only. It can be select, which will show a combo box, or checkboxes which will show one checkbox for each distinct value. The distinct values are dynamically queried by Lizmap Web Client.
Splitter: for tje Unique values type only. Use if you want to split the field values by a separator. Ex: “culture, environment” can be split into “culture” and “environment” with the splitter “, “.
The order of the lines in the configuration table is taken into account to show the field inputs in the form.

Description des différents types de champ du formulaire
Texte
Le type le plus simple. Avec ce type d’entrée, l’utilisateur verra une entrée classique de type texte. Vous pouvez saisir n’importe quel texte et validez. L’autocomplétion est activée par défaut, ce qui signifie que Lizmap retrouvera les valeurs uniques pour ce champ. Ceci pourrait dans le futur devenir optionnel si certains jeux de données étaient trop gros et que l’autocomplétion devenait trop lourde.
The filter built will be like: « field » LIKE “%foo%”
Date
This input type will show a slider with 2 handles to allow to search between the two selected values. The two text inputs are also shown and can be used to manually set the min and max dates.
La date est « tronquée » à un format date (pas de donnée temps tel que les heures, minutes ou secondes actuellement).
Le pas du slider est codé en dur et vaut 86400 secondes, ce qui représente 1 jour.
The filter built will be like: ` ( ( « field_date » >= “2017-04-23” OR « field_date » >= “2017-04-23” ) AND ( « field_date » <= “2018-06-24” OR « field_date » <= “2018-06-24” ) ) « `
Numérique
This input type will show a slider with 2 handles to allow to search between the two selected values. Two text inputs are also shown and can be used to manually set the min and max values.
The filter built will be like: ` ( ( « field » >= 100 ) AND ( « field_date » <= 200 ) ) « `
Valeurs uniques
Lizmap will query the data to get the distinct values of the field. You can choose two different input types: select or checkboxes.
If you have specified a splitter text, for example , `, Lizmap will find the unique values of the separated text values. Fo xample the value of one feature `”culture, environment” will be split into “culture” and “environment” with the splitter “, “. Selecting culture or environment in the form input will show this feature.
Vous pouvez choisir de montrer deux types de champ différents :
Combo box: this type will show a combo box with the list of distinct values for the field. The user will be able to choose only one item among the values.
Checkboxes: this type will show as many comboboxes as distinct values for the field. The data will be filtered with a UNION between checked items.
The filter built will be like: ( "field_thematique" LIKE “%Cuisine%” OR "field_thematique" LIKE “%Ecocitoyen%” )
Changing the default image of a project in the repositories and projects site
Par défaut, l’image suivante est affiché pour un projet :
You can change this default image by adding in the same project folder a .png image with the exact project name and extension. Example: If the project is called montpellier.qgs you can add an image named montpellier.qgs.png. Note that the image has the project extension too.