Portadas
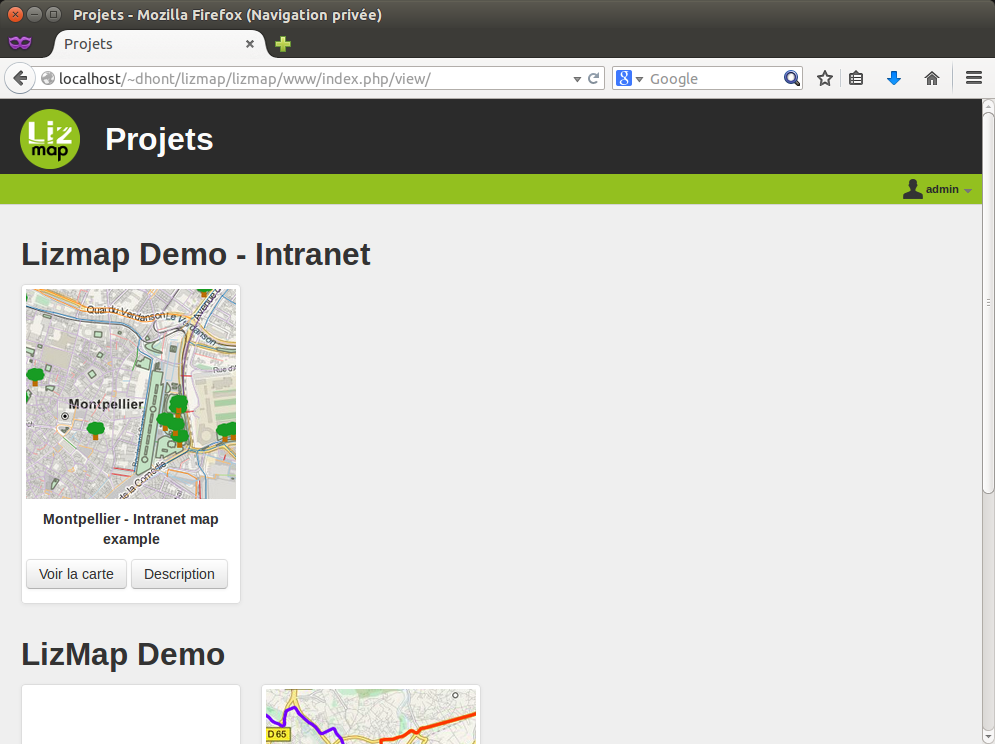
La portada por defecto de lizmap ofrece un listado de mapas organizados por carpetas.
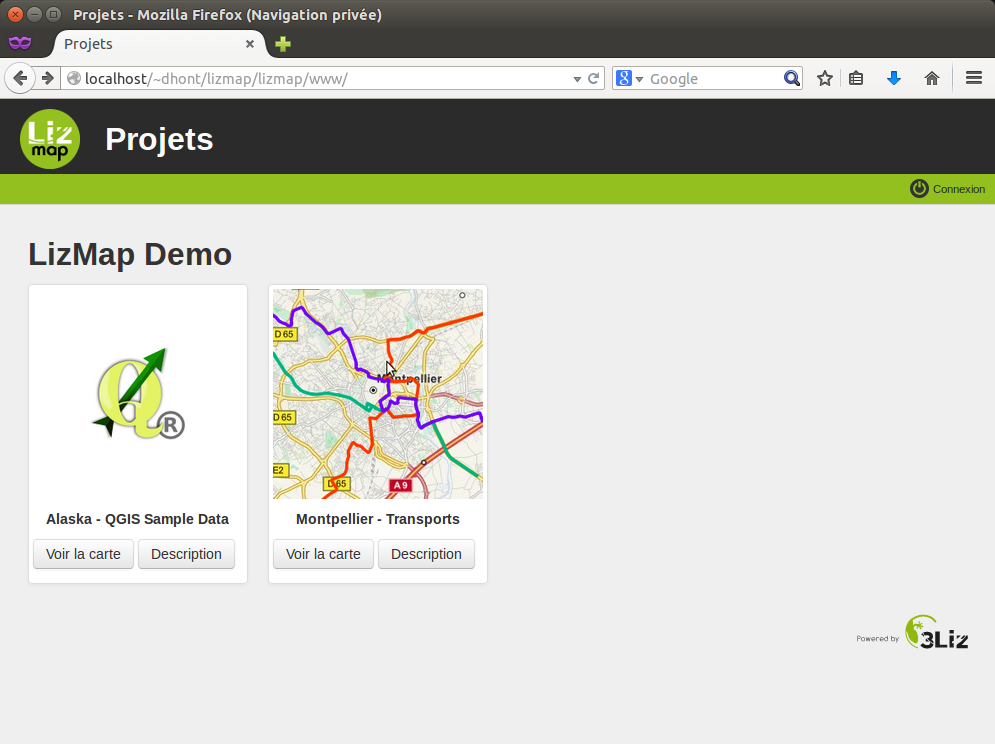
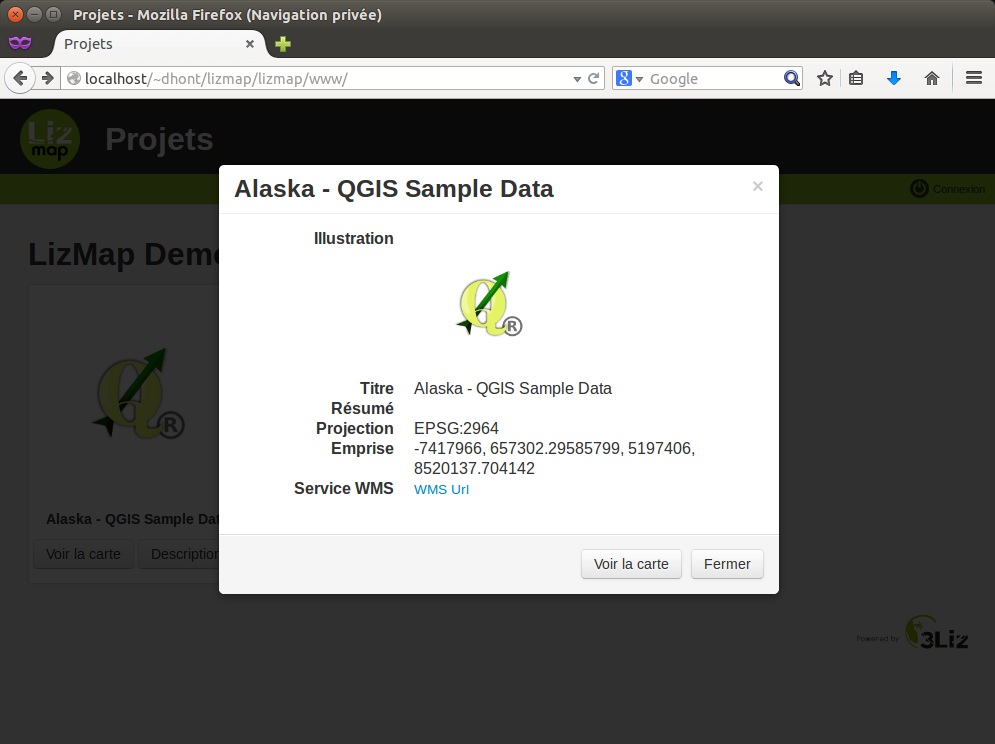
Puedes acceder a la hoja con la información del mapa. Esta información se origina directamente desde el proyecto de QGIS.
Se puede acceder al mapa o bien clicando en el botón Load the map o en la imagen que acompaña al proyecto.
Un mapa sencillo
Lizmap ofrece mapas online por defecto con las siguientes características:
pan
zum a un area definida por el usuario
Más zum
Seleccionar un nivel de zum desde una escala
Menos zum
Visualización de la escala gráfica y numéricamente
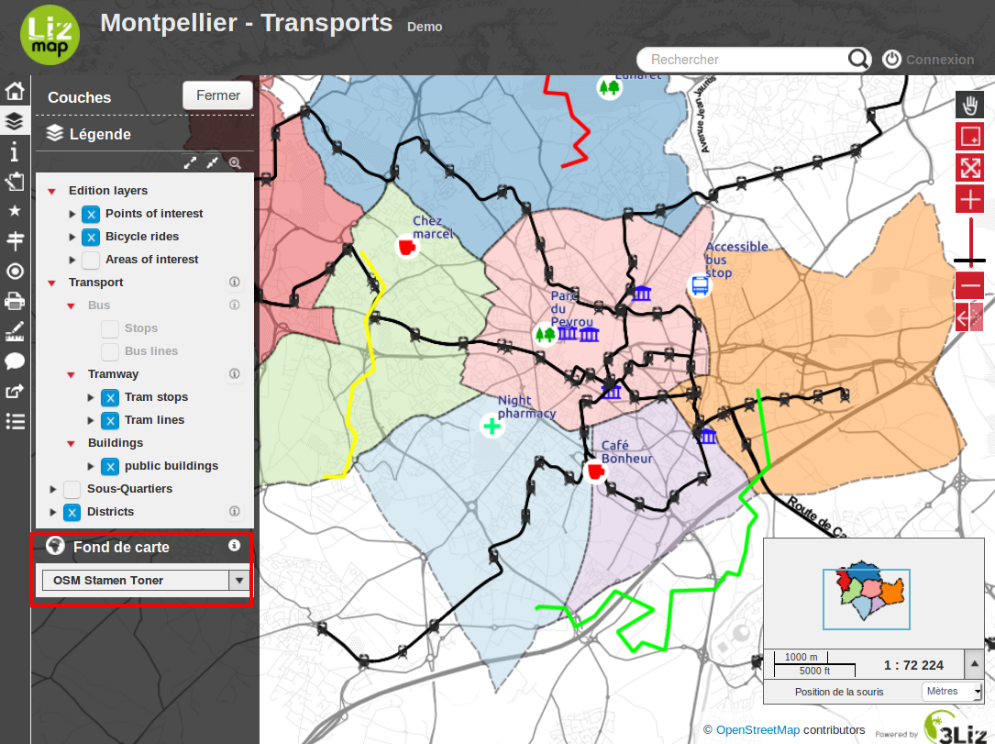
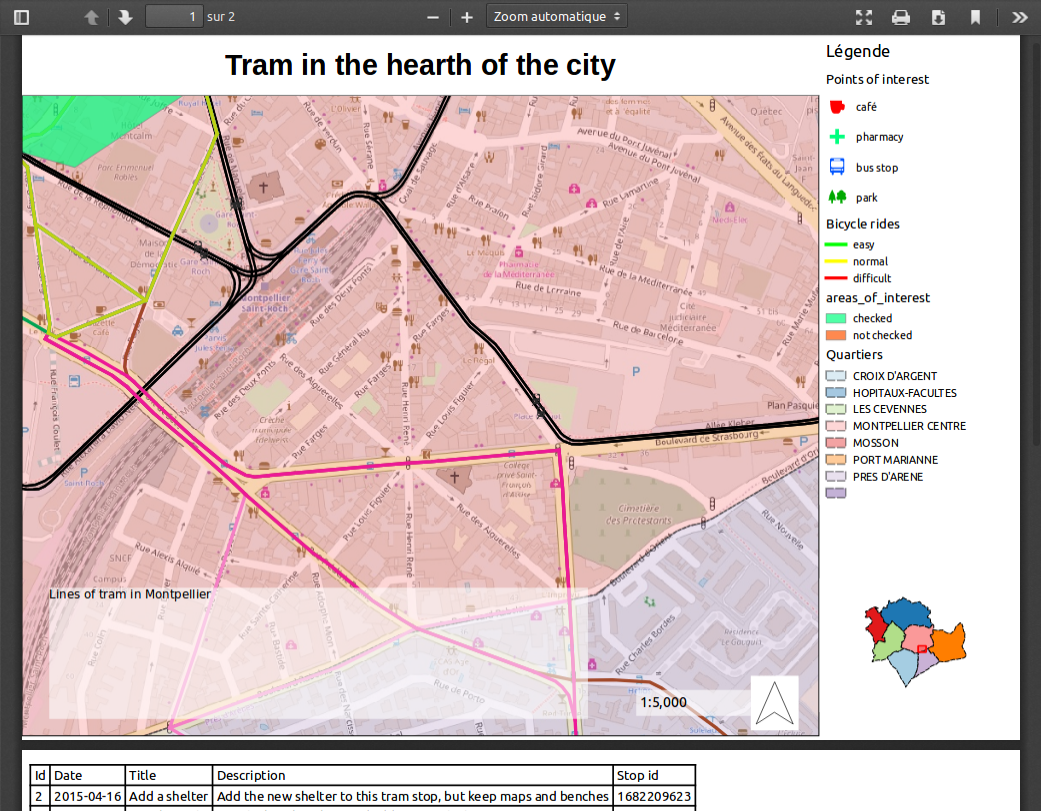
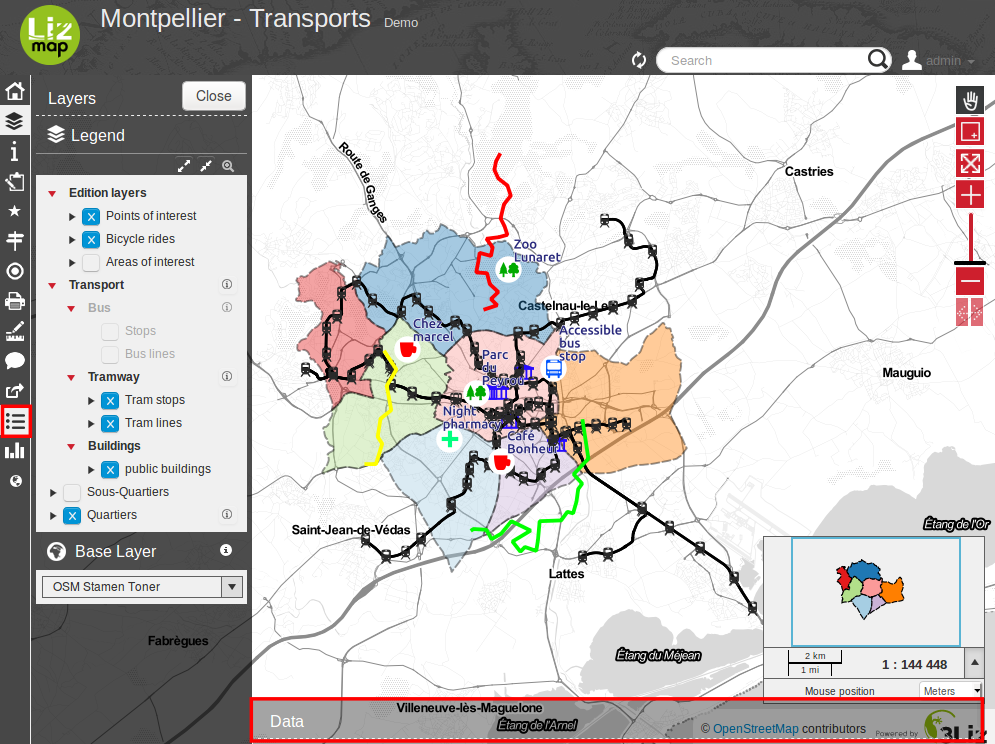
El orden y organización de las capas coincide con en el que se hadefinido en QGIS en el panel de control de capas del map publisher.
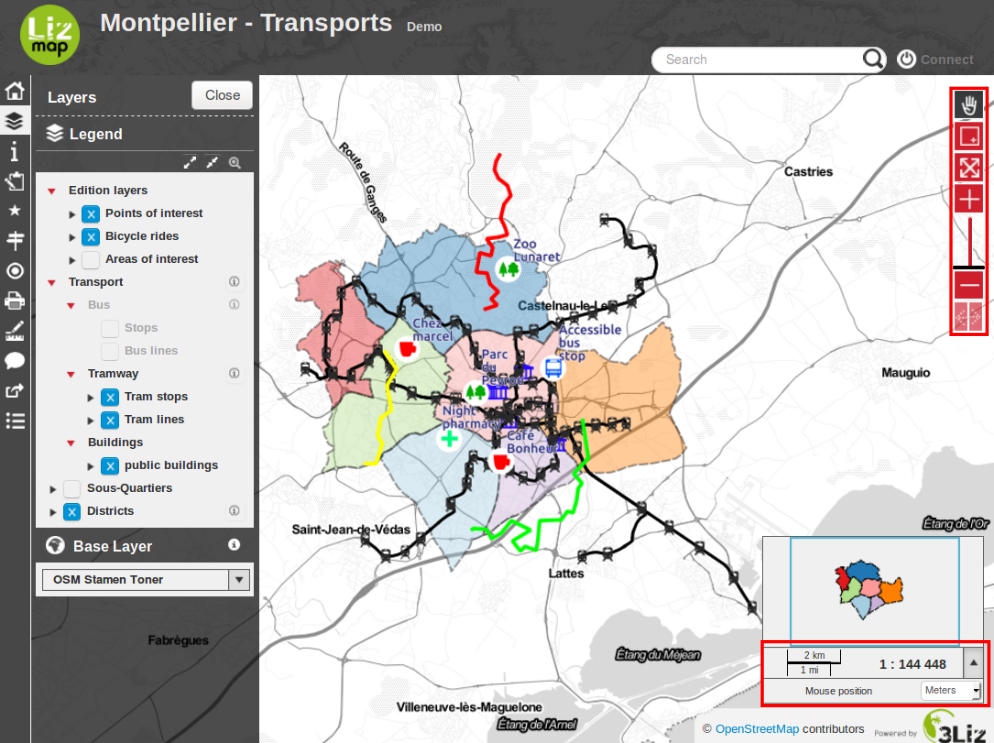
Las opciones de zum y pan se localizan a la derecha del mapa. Parahacer zum sobre un area hay que seleccionar el botón zoom by rectangle y arrastrar sobre el mapa el puntero del ratón dibujando la diagonal.
Es posible visualizar la leyenga de cada capa desplegándola, haciendoclick en el triángulo que se encuentra a la izquierda de cada capa.
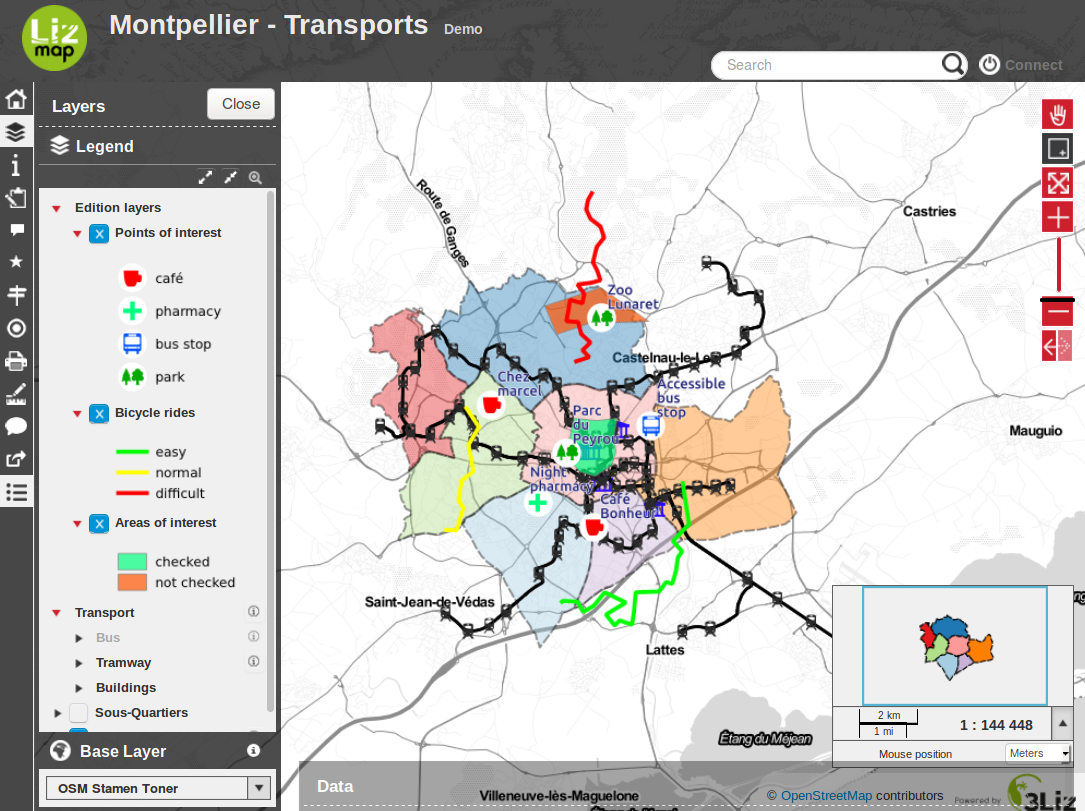
Las cajas de selección junto a cada capa permiten visualizarlasy ocultarlas.
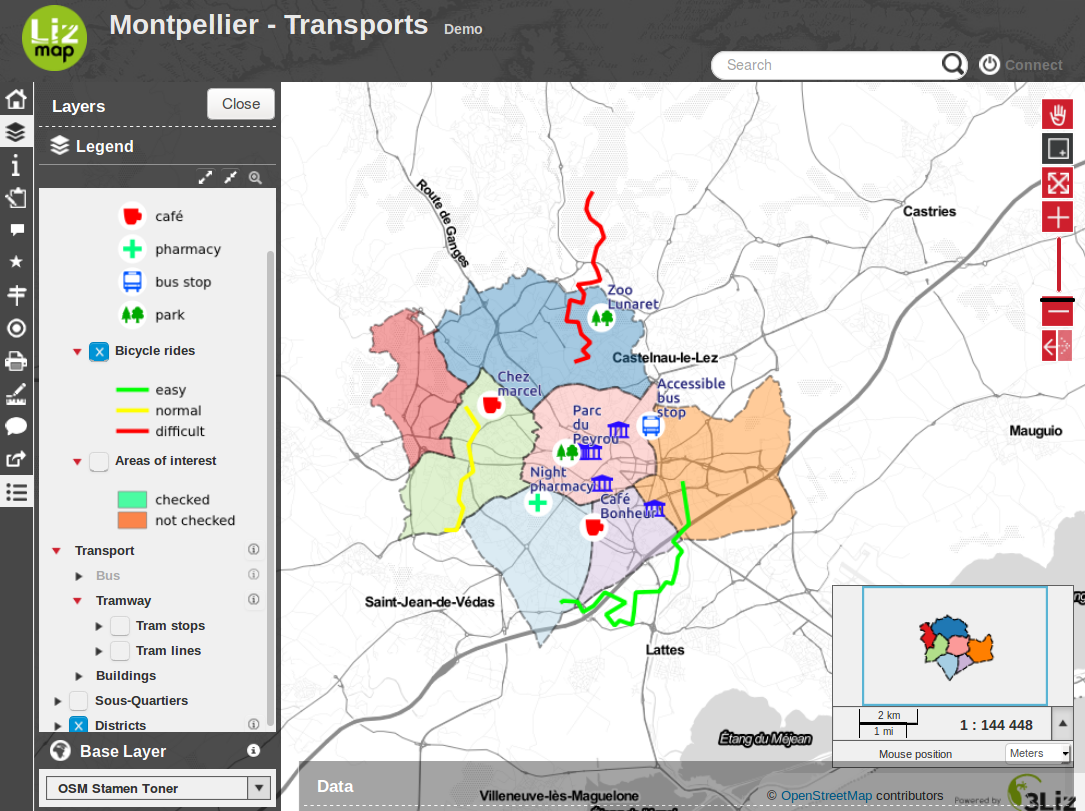
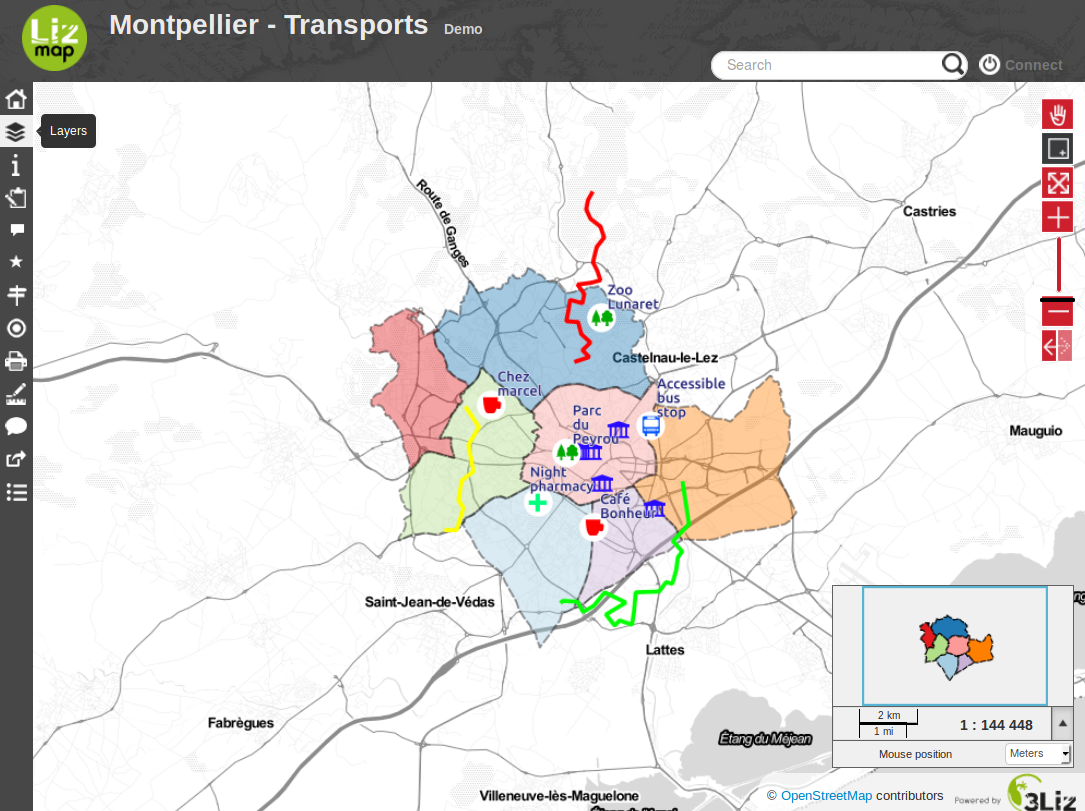
El paner de control de las capas de puede ocultar para obtener unavista completa del mapa.
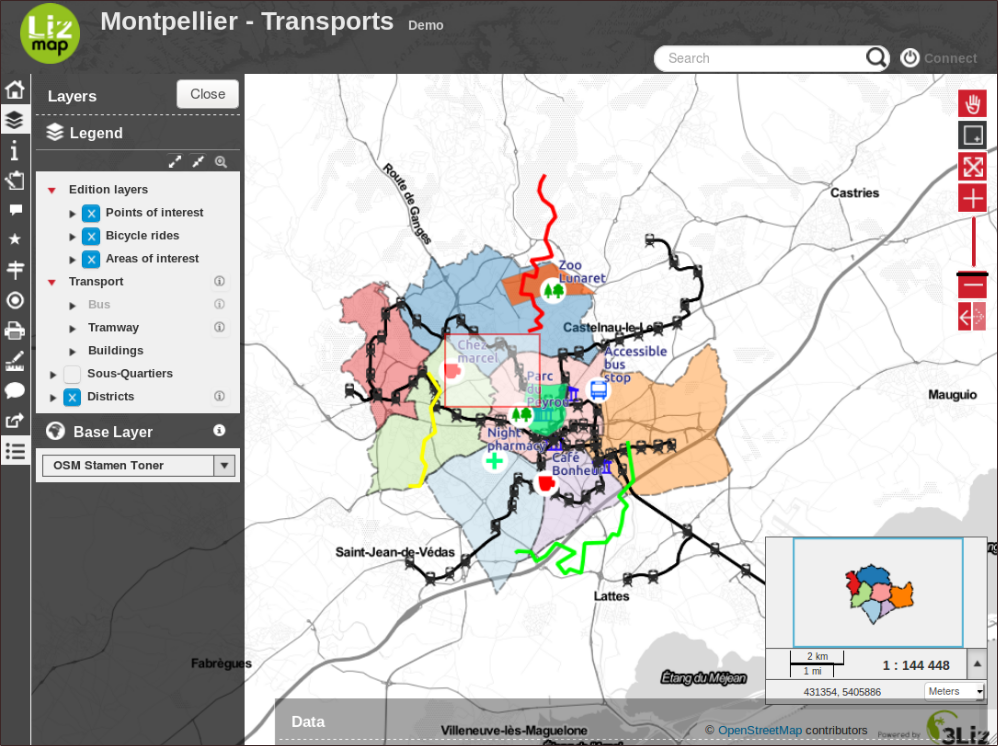
Por último, es posible:
volver a la portada del proyecto
visualizar la hoja con imformación del mapa
Identificación
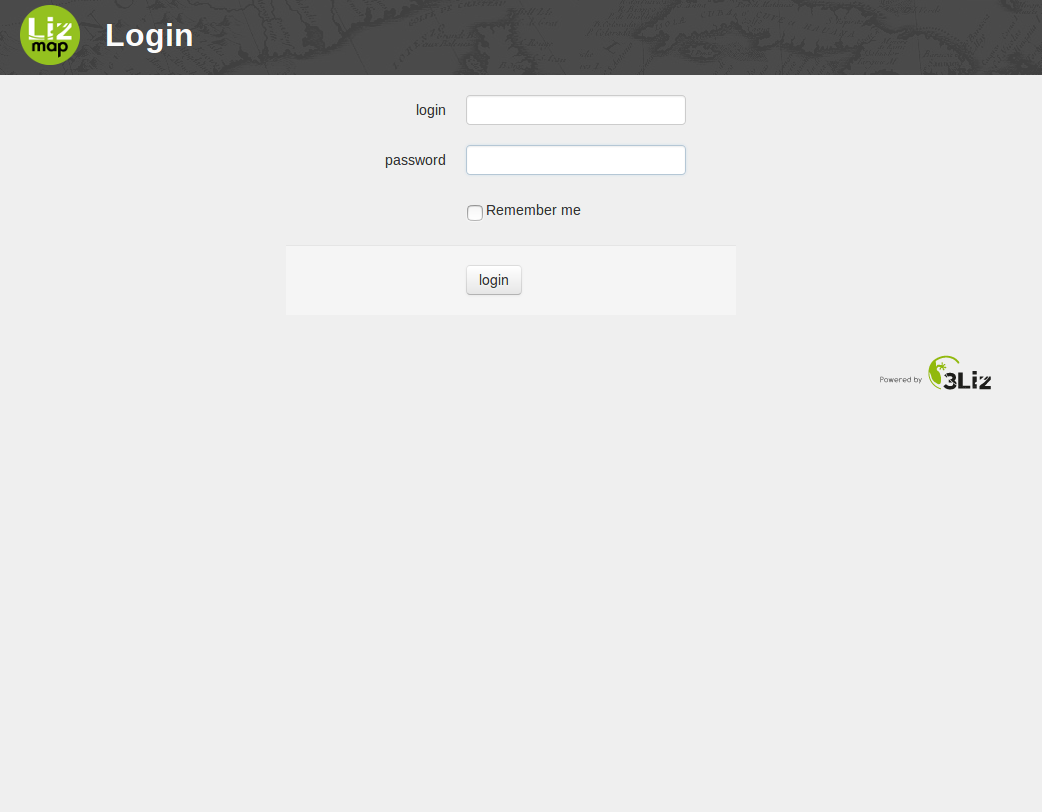
El administrador puede restringir el acceso a ciertos mapas. Paraacceder a esta información es necesario identificarse. El botón Connect,situado arriba a la izquierda, da acceso a este proceso de identificación.
Una vez que el usuario se ha identificado, según sus privilegios, podráacceder a nuevos mapas.
Puedes cerrar la sesión y editar la información de usuario
Características avanzadas
El map publisher puede añadir algunas características según lasnecesidades del usuario.
seleccionar un mapa de base
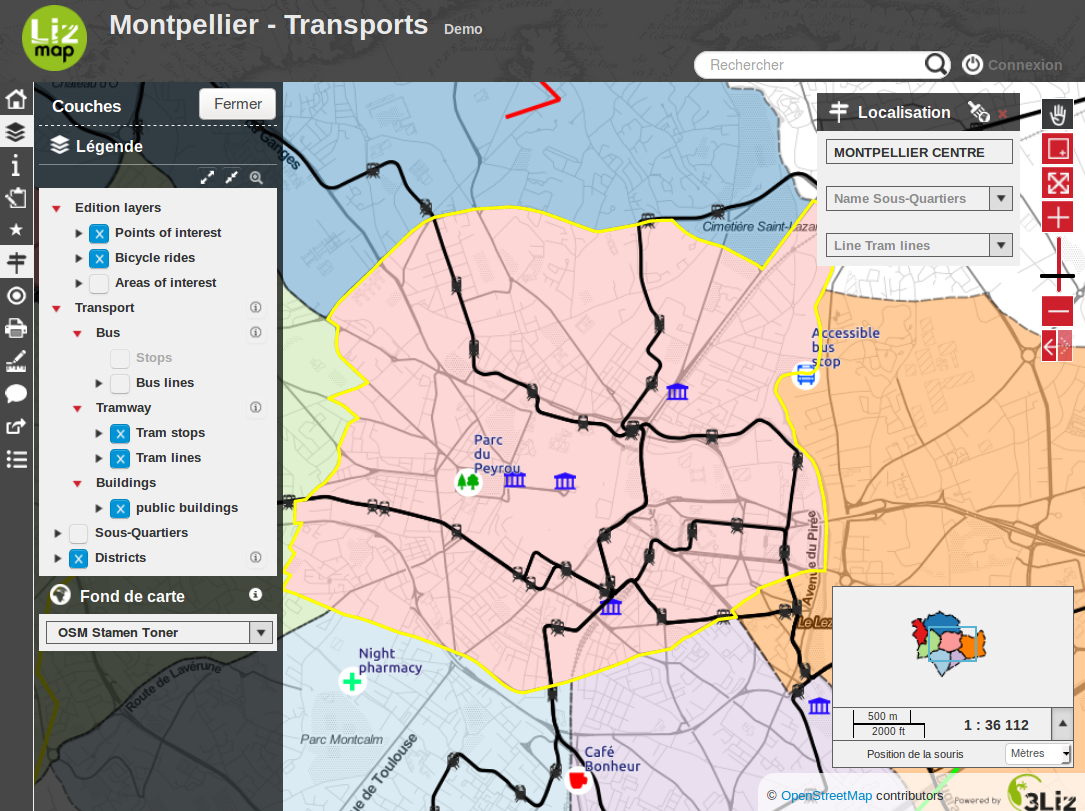
localización por capas
medida de distancias, áreas y perímetros
impresión del mapa
edición de los datos
estadísticas

seleccionar un mapa de base
Con el plugin de Lizmap, el editor puede añadir mapas de base externoso una capa de base vacía al mapa. Estos mapas de base están disponibles en elpanel de cotrol de capas como una lista.
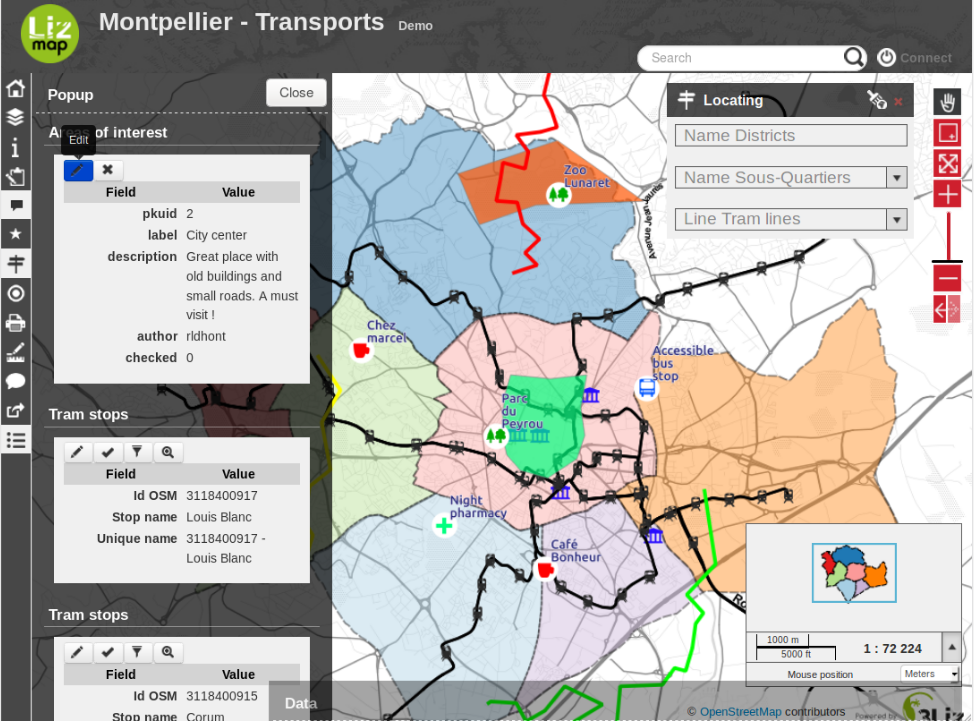
Localización por capas
Esta propiedad se visualiza por defecto si se ha activado en el mappublisher.
Se encuentra sobre el panel de control de capas como una lista desplegable.
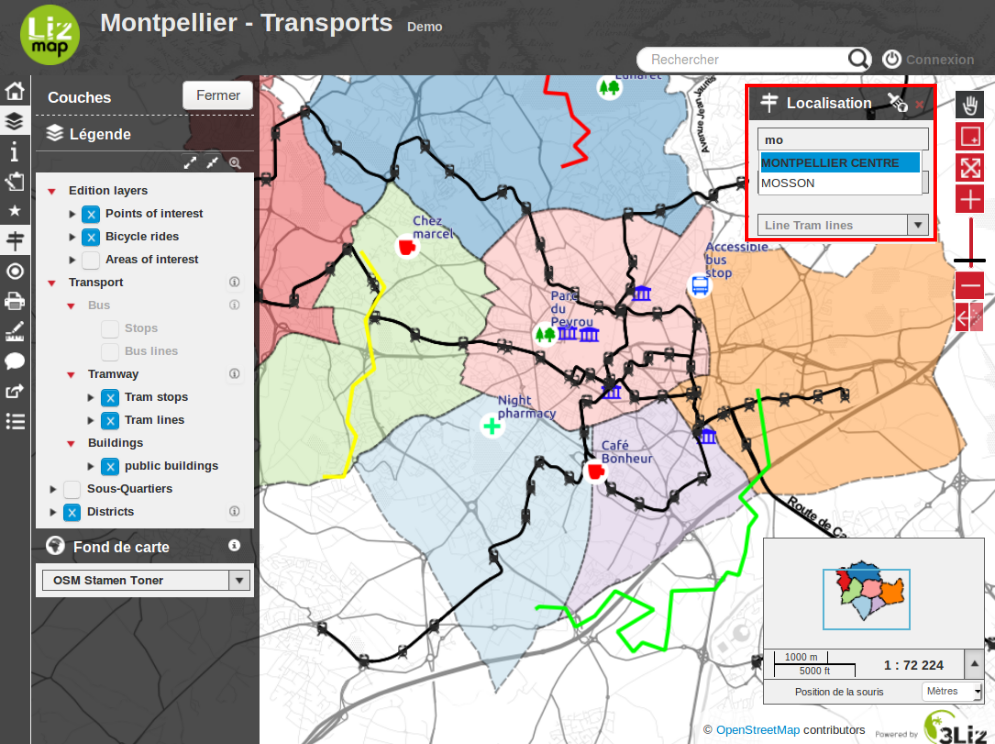
Es suficiente con seleccionar una localización del desplegable paraque automáticamente se haga zum sobre esta localización.
Medidas
Con la herramientas de medida es posible calcular:
una distancia
un área
un perímetro
Se encuenra en la barra de menú de Lizmap
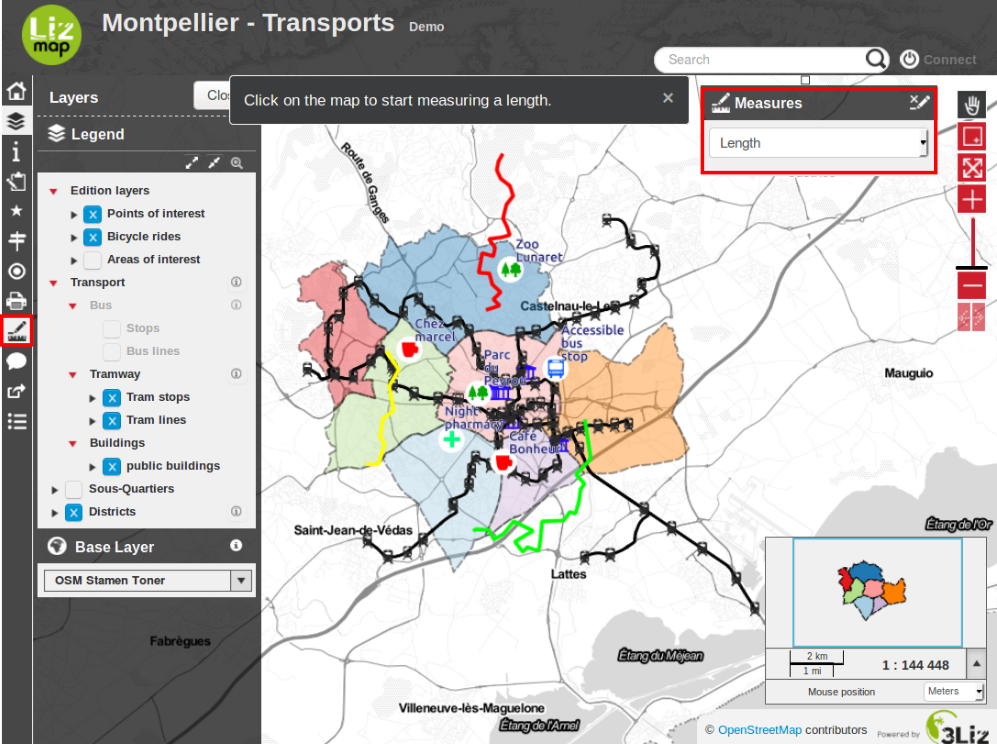
Esta herramienta se activa seleccionando el tipo de medida. Mientrasesté activada esta herramienta, se visualizará un mensaje de información.
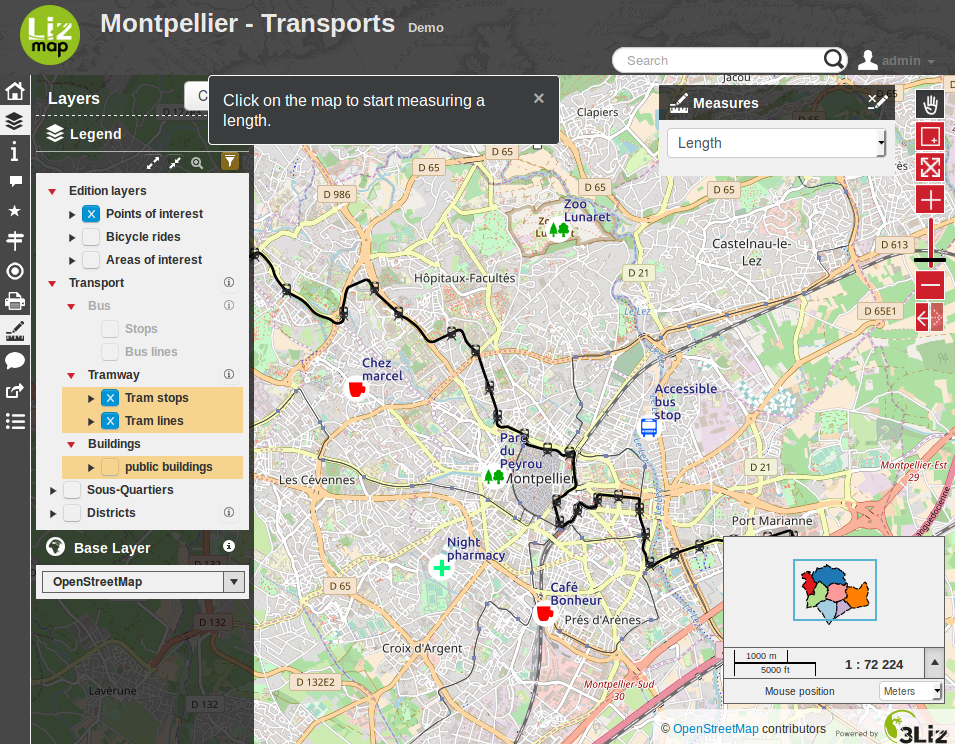
La medida se visualiza en la barra de estado.
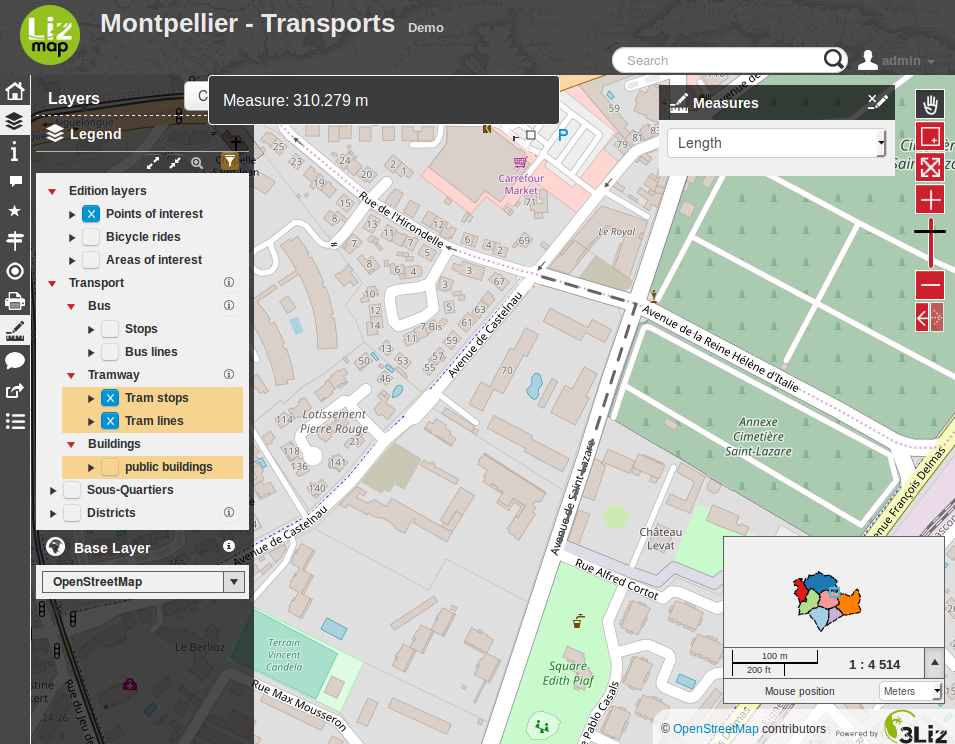
La medida se define con doble click sobre el mapa. Para tomar otra medida,es suficiente con clicar una vez sobre el mapa.
El botón situado a la derecha en la barra de herramientas detiene laherramienta de medida.
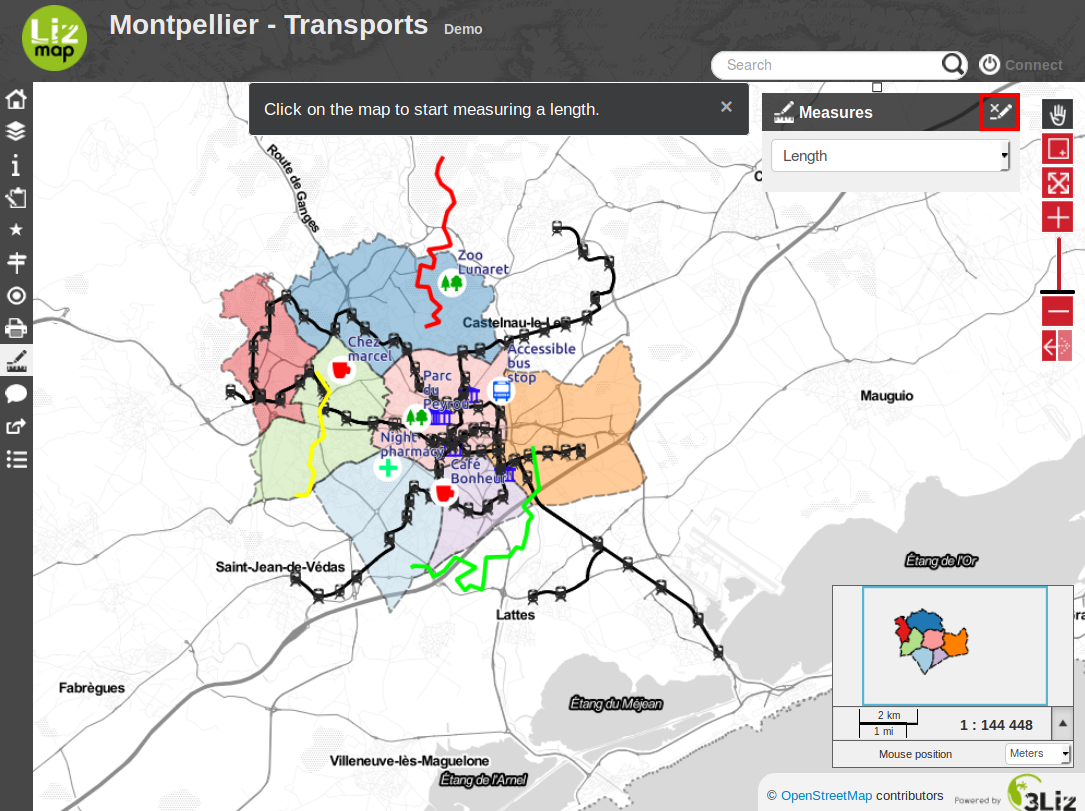
Aunque también es posible cambiar de herramienta sin detener previamentela herramienta de medida.
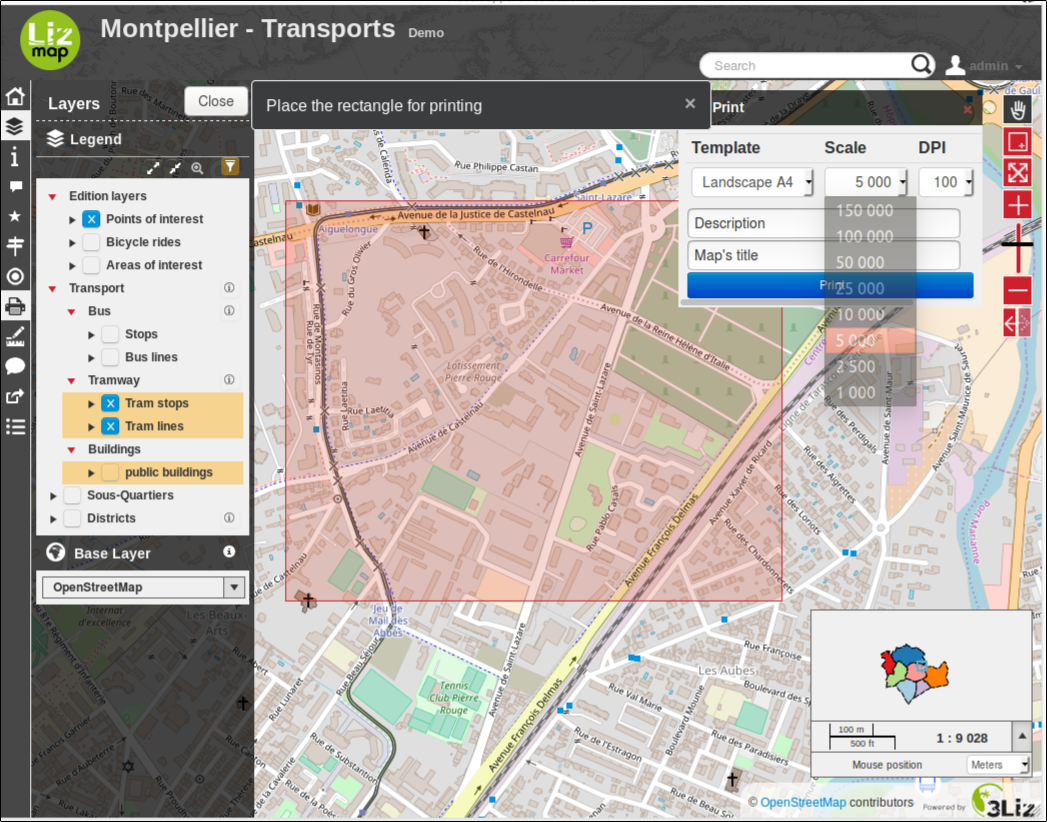
Impresión
La herramienta de empresión se encuentra en la barra de menú. Dependedel número configuraciones de impresión que se hayan definido.
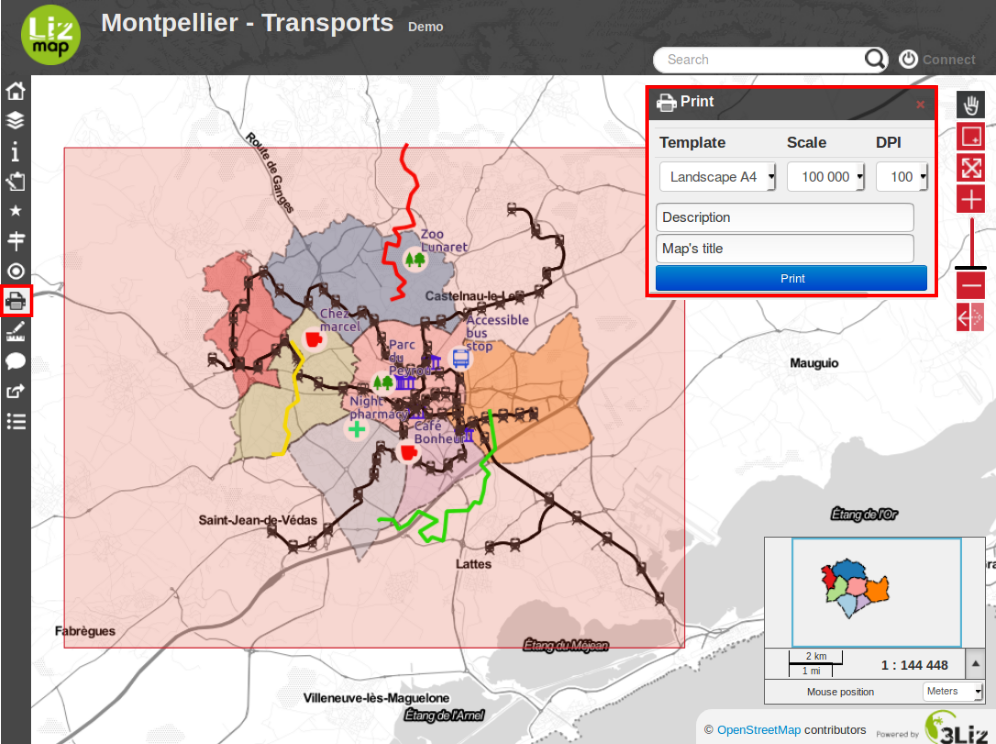
Una vez qe se activa la herramienta, se visualiza sobre el mapa un áreade impresión según la configuración elegida, que puede desplazarse por el mapahasta hacerla coincidir con la zona deseada.
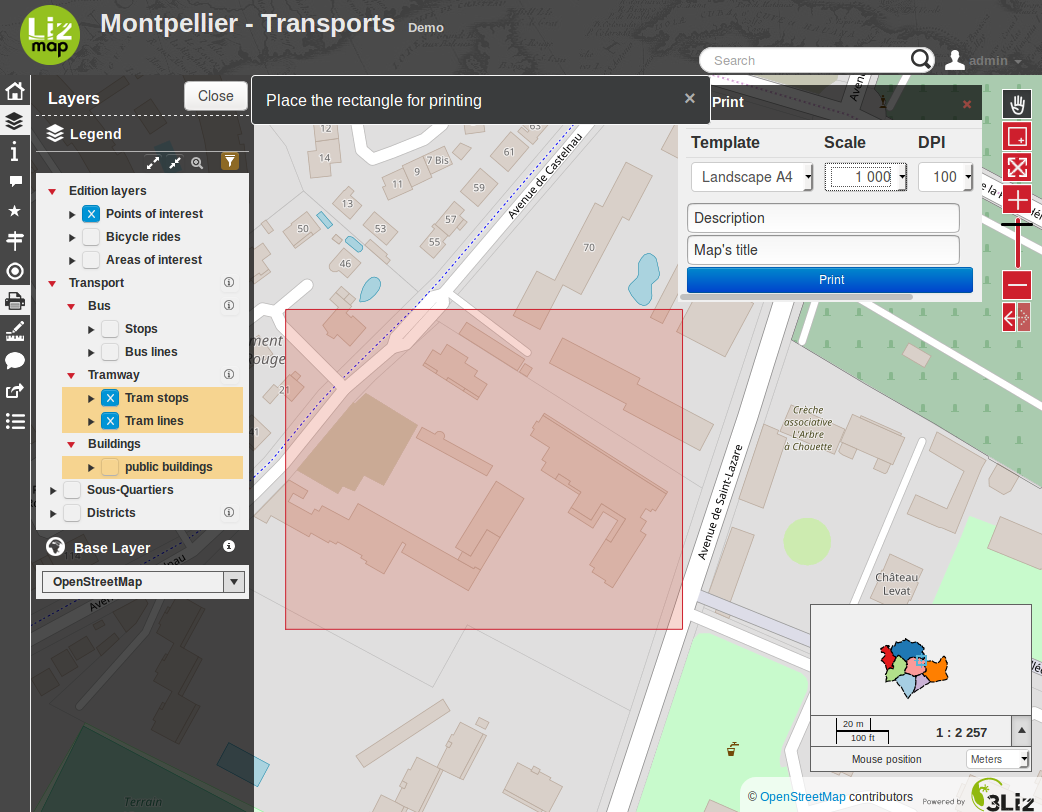
A la izquierda, sobre el panel de control de capas, se puede seleccionar la escalar de impresión.
Según la configuración de impresión definida, existe la posibilidad deañadir texto adicional.
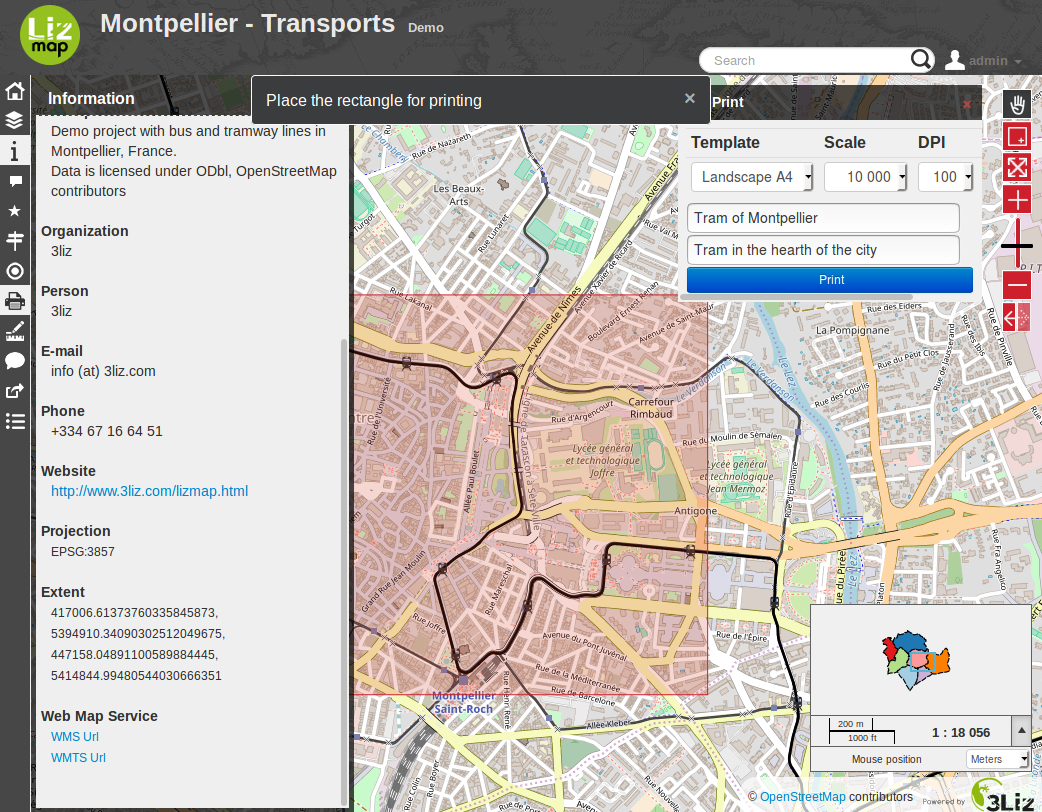
Para comenzar la impresión, se clica en Print. Se obtendrá un archivoPDF con el layout definido por el map publisher.
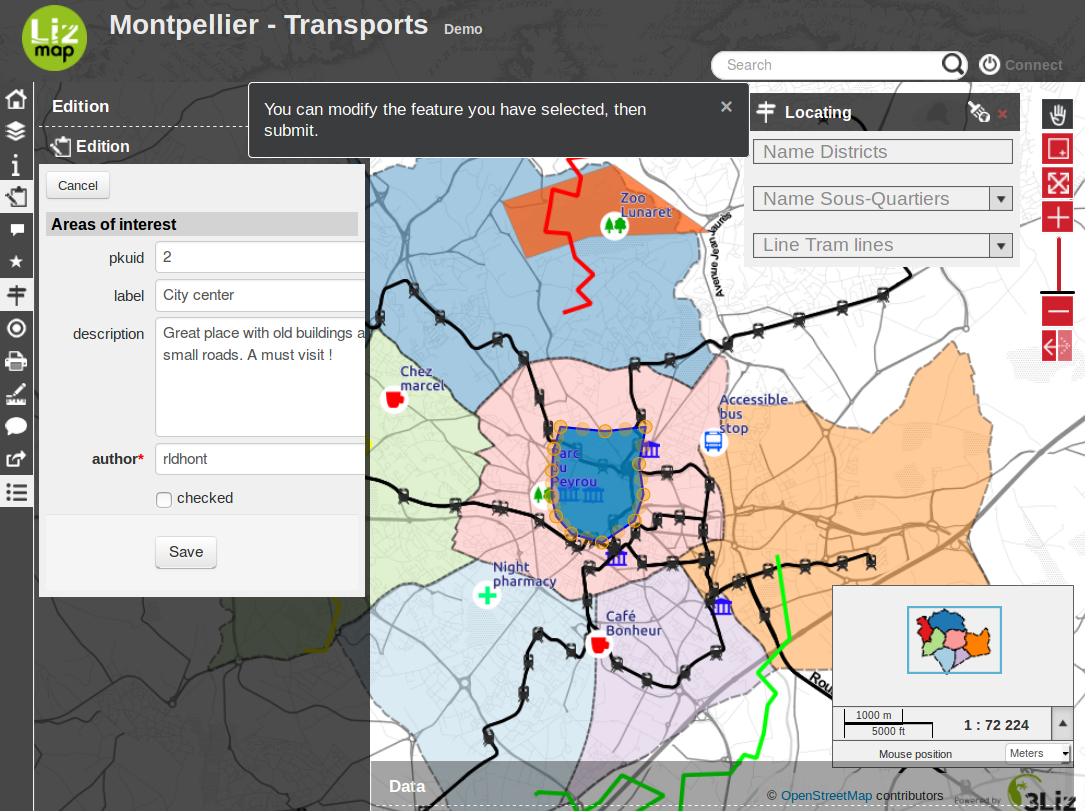
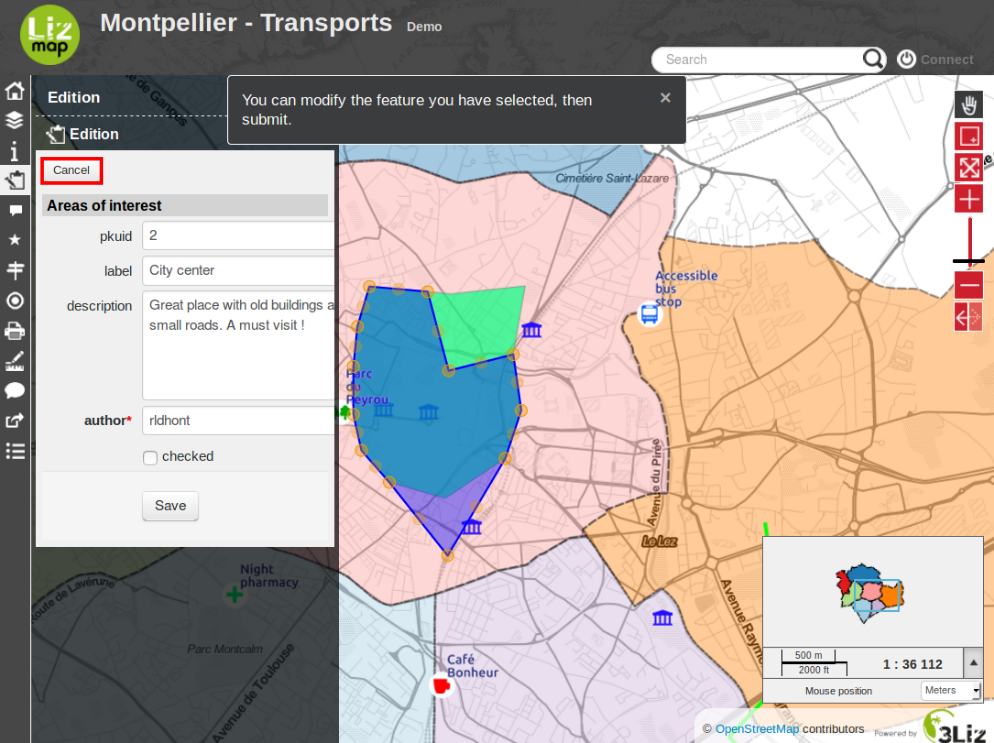
Edición de datos espaciales
El map publisher puede mermitir la edición de determinados datos.También tiene la opsción no limitar los cambios.
Añadir objetos espaciales
Modificación de la geometría
Modificación de la información alfanumérica
Eliminación de objetos espaciales
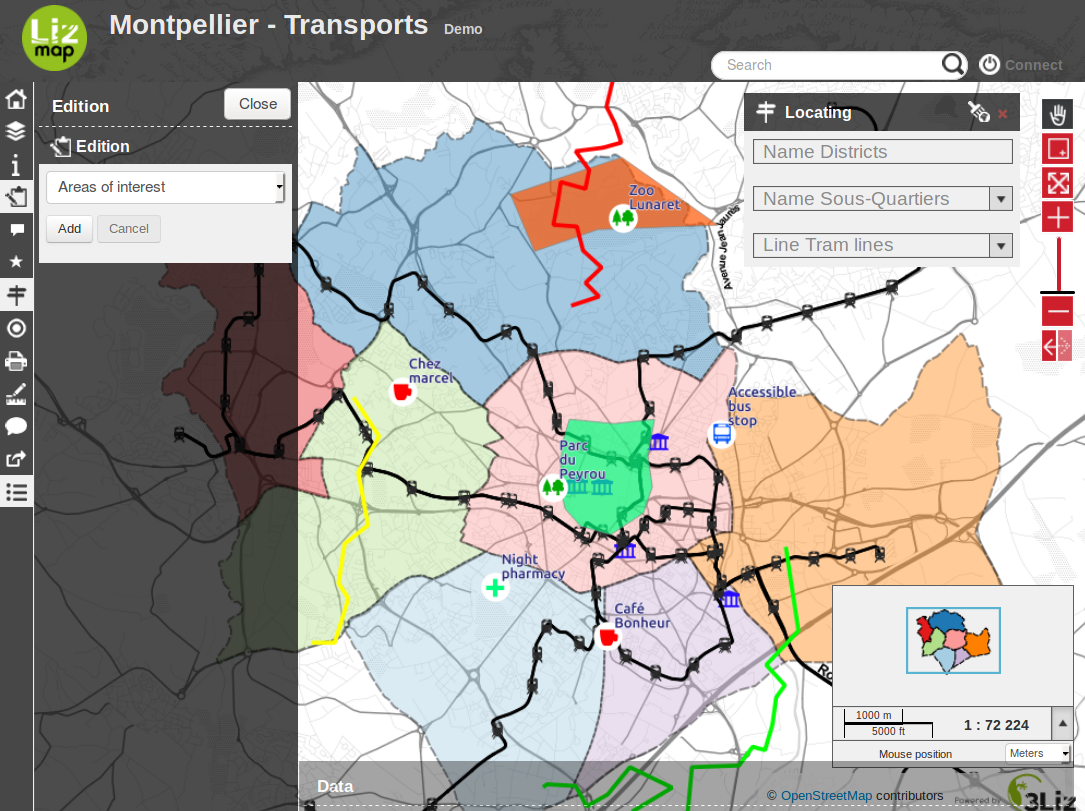
Esta herramienta está disponible en la barra de menú de Lizmap. El menúde edición permite seleccionar los datos que se desea modificar.
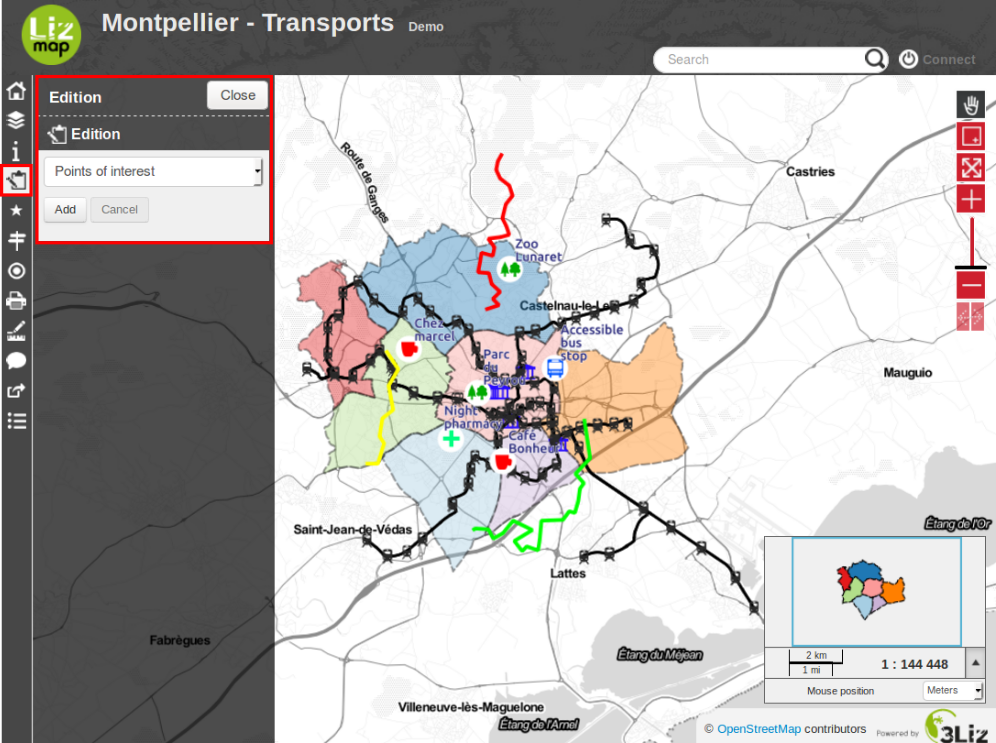
Una vez que se ha seleccionado una capa, aparece el panel de edición,que varía según la configuración diseñada por el map publisher. Si es posible,hacer cambios,se puede elegir entre añadir un nuevo objeto, botón Add, oseleccionar un objeto, botón Select.
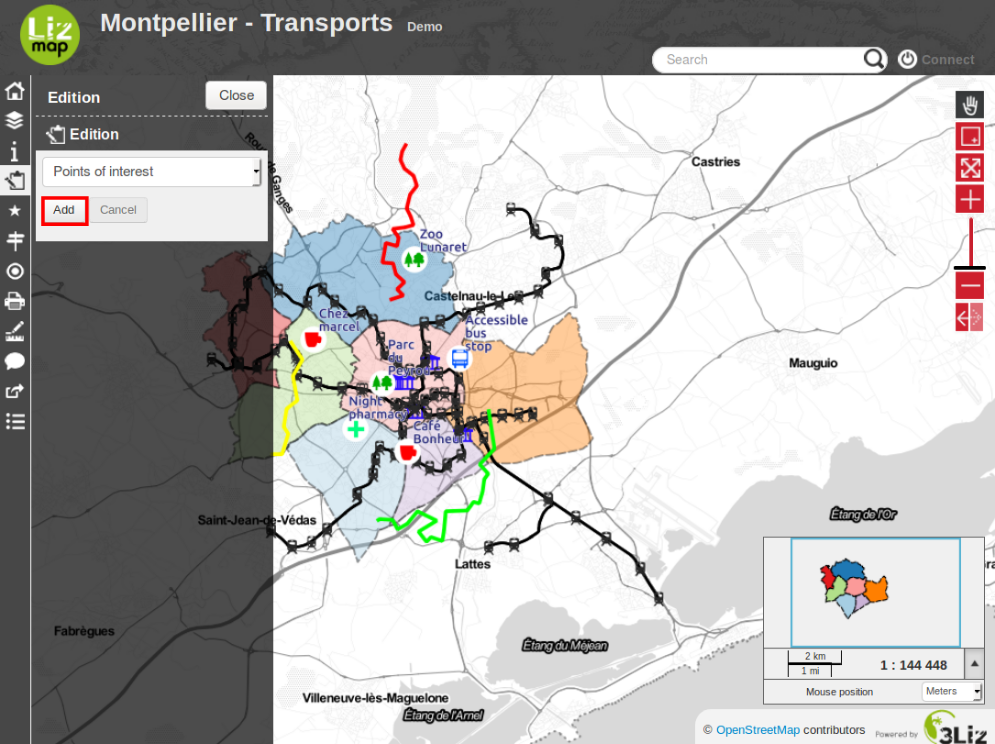
Si se ha seleccionado Add, el usuario opodrá dibujar una geometríasegún el tipo de datos de la capa seleccionada.
punto
línea
polígono
En el caso de líneas o polígonos, el usuario tendrá que clicar variasveces sobre el mapa para dibujar la forma deseada.
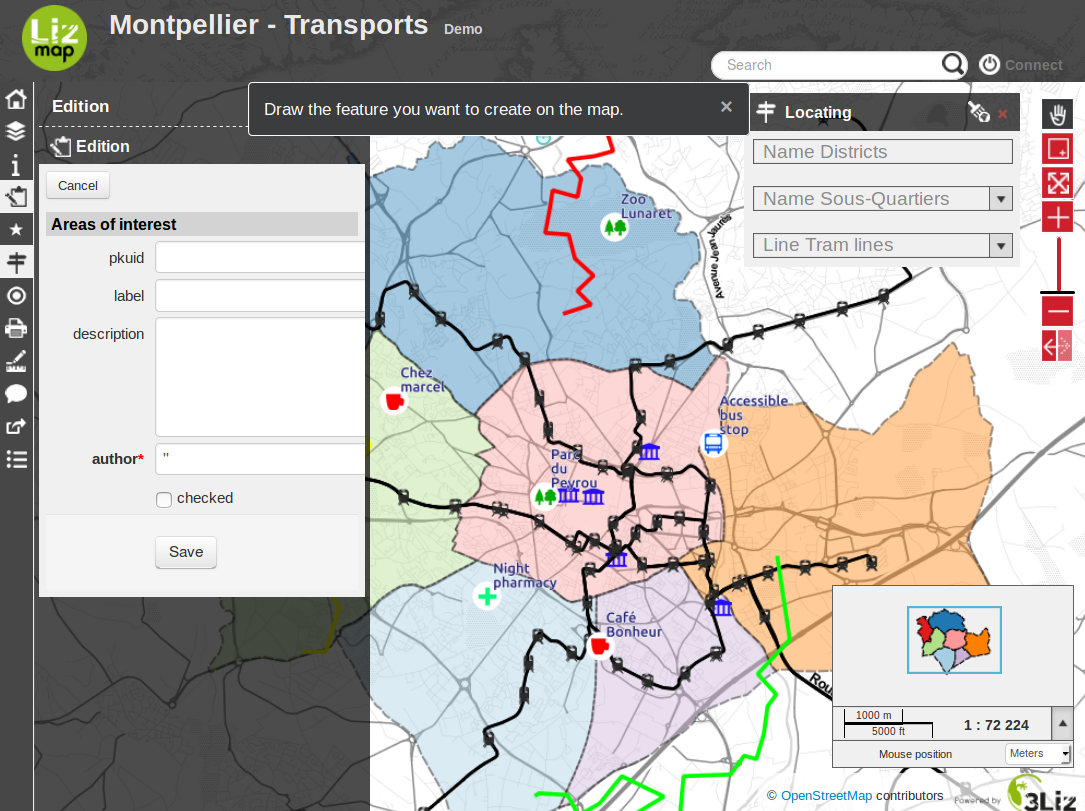
Para terminar el dibujo de líneas o polígonos hay que hacer un dobleclick sobre el último punto deseado. Una vez se termina el dibujo, aparece unformulario para editar la información alfanumérica.
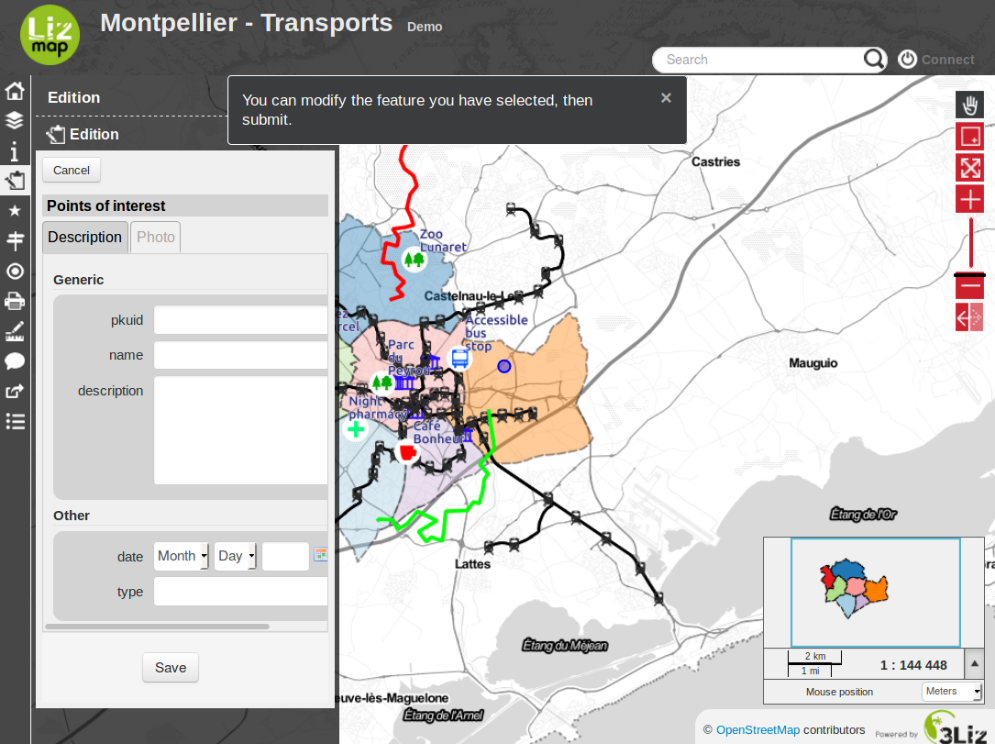
Para anular la edición de la geometría, hay que clicar en Cancel.
Si la geometría es correcta y se han introducido correctamente los datosalfanuméricos, se guardan haciendo clic en save. Así se añadirá el nuevo objeto.Para modificar este objeto habrá que seleccionarlo como veremos a continuación.
Para seleccionar un objeto para actualizarlo, debes seleccionarlo en el mapa y después pulsar el botón Edit.
El objeto seleccionado aparece sobre el mapa y su geometría se puedrámodificar directamente.
Puedes deshacer los cambios de geometría empleando el botón Cancel.
To validate your geometry modifications or simply access the editing form for fields, you must click Save.
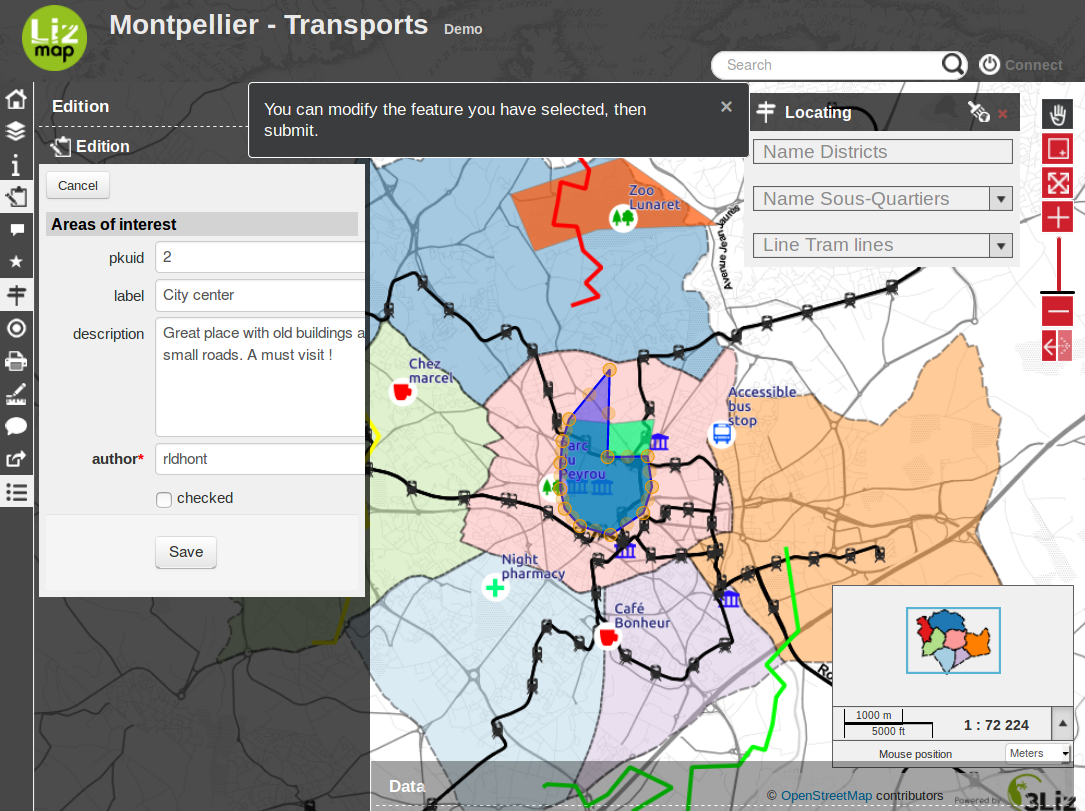
Aparecerá entonces el formulario de edición de datos alfanuméricoscon los datos del objeto seleccionado.
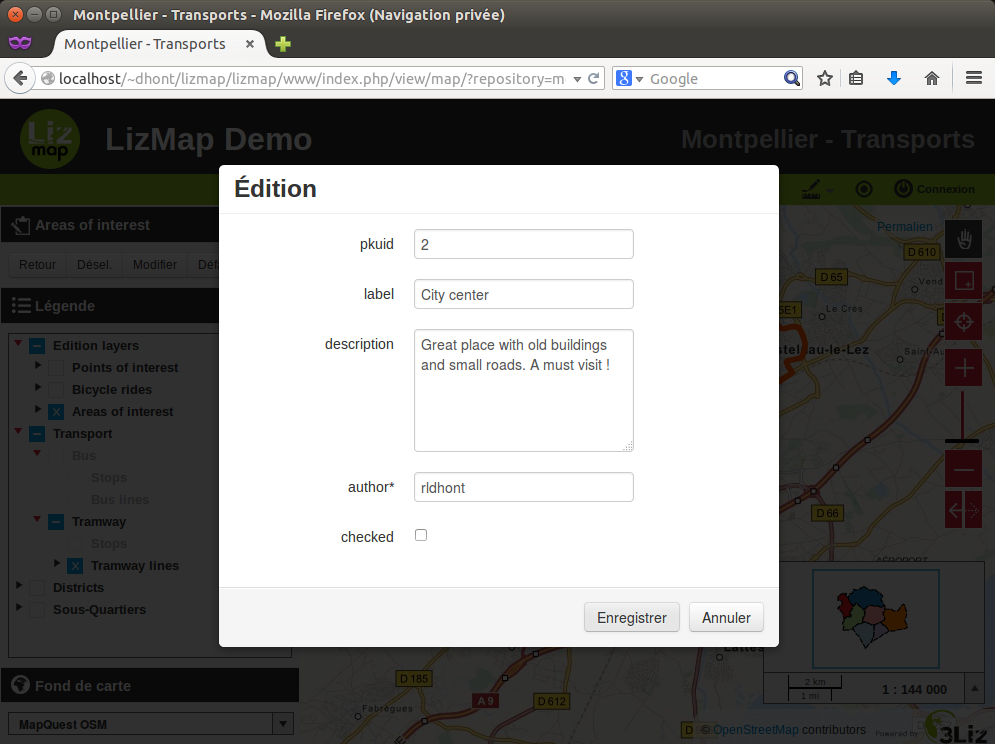
El botón Save guarda los cambios de geometría y atributos alfanuméricos.
Si se desea elimitar el objeto seleccionado, hay que clicar en Del
Finally, to disable editing tool, simply click on Close or click again on the Edition icon.
Atributos de capas
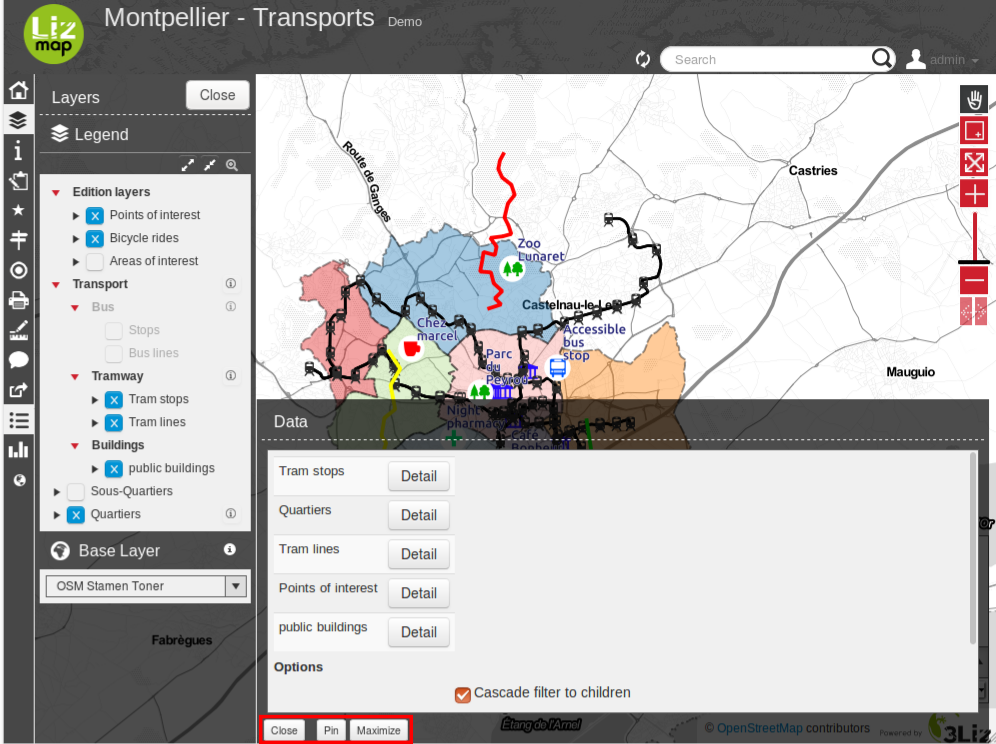
When this feature has been enabled by the map publisher for one or many vector layers, a new menu entry will be visible at the bottom of the menu bar, labelled as Data.
Clicking on this icon will open a new panel situated at the bottom of the interface, containing one single Data tab with a list of published vector layers.
Comportamiento del panel de tabla de atributos
Since this panel is situated above the map, some default behaviours have been proposed to ease the consultation of the data in the map and in the table at the same time.
The attribute table panel takes half the size of the screen
It is automatically reduced at the bottom when the mouse is out of it, and automatically displayed back when the user moves the mouse over the bottom of the map.
You can change the default behaviour by using the buttons displayed at the bottom of the attribute table panel
The Pin button deactivates the automatic reduction of the panel when the user mouse leaves it. But in this case, the whole panel will be displayed half transparent to allow the user to see the map underneath.
The Maximise button expands the panel so that it occupies the total place left between the left panel and the map header. This is handy when you need to have a confortable view of the layer data. In this configuration, the attribute table panel is also pinned, and won’t be reduced when the mouse leaves the panel, for example when hovering the left panel with the legend. But in this case, only the opacity of the attribute table panel will change so that you can see the map underneath.
You can click back on any of these 2 Pin and Maximise button to get back to the default behaviour.
The Close button closes the attribute table tool completely (as if you clicked in the menu bar icon).
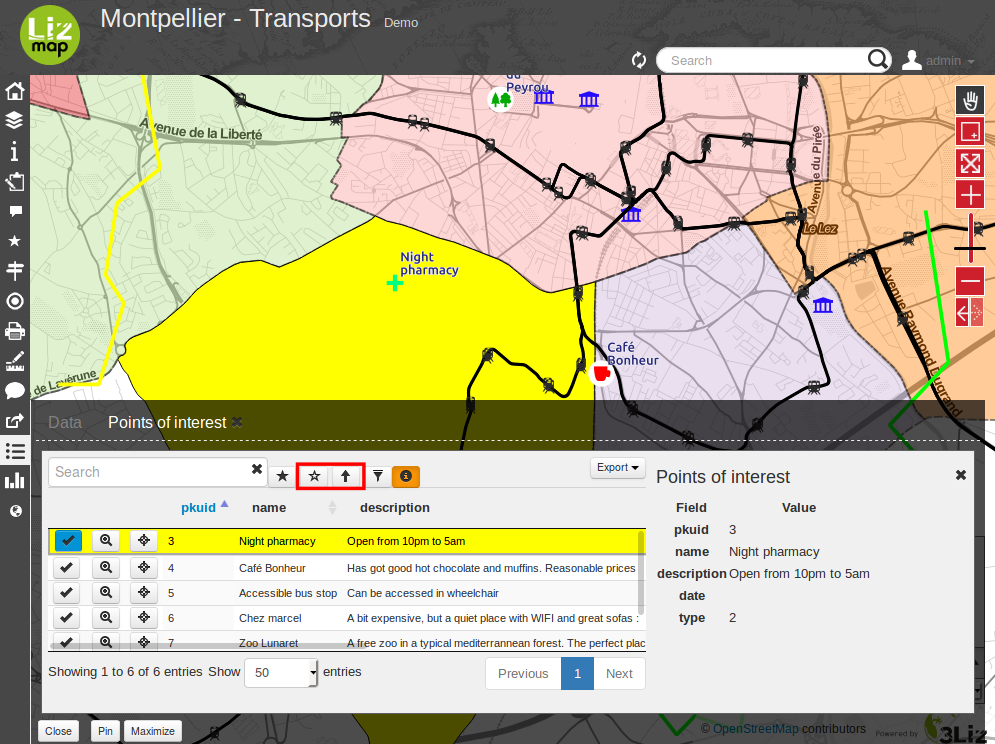
Abrir la tabla de atributos para una capa
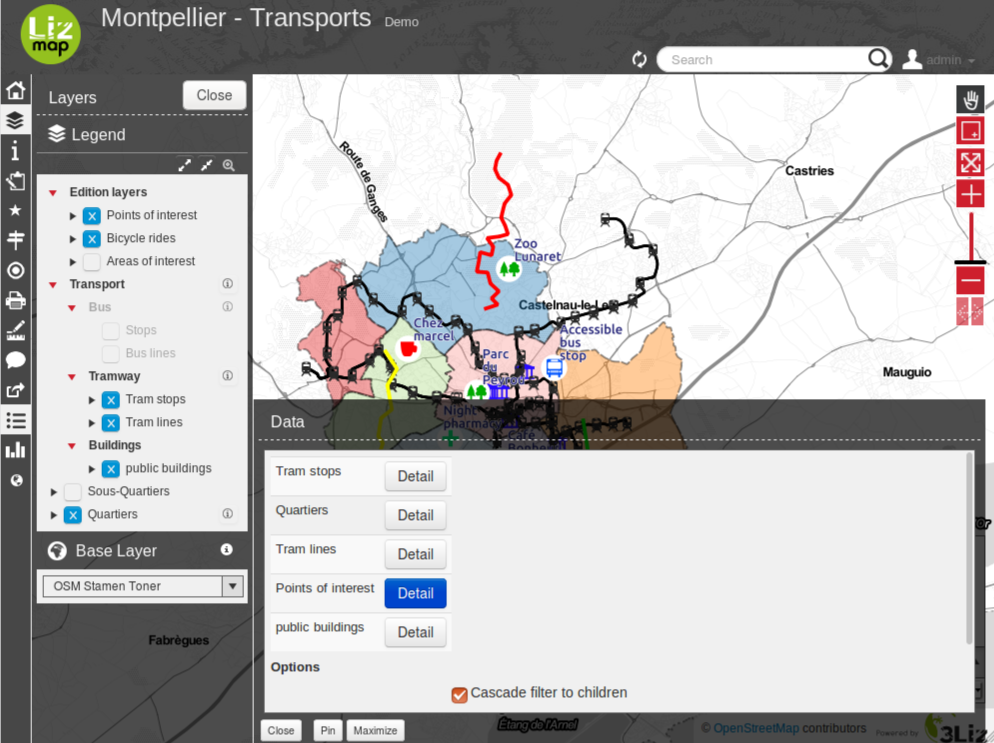
Once the attribute table panel is displayed, you can open the attribute table of each vector layer by clicking on the button situated right to the layer name. This will open a new tab labelled with the layer title which will show the attribute table for the chose layer.
Opening an attribute table can take some time depending on the data size and complexity.
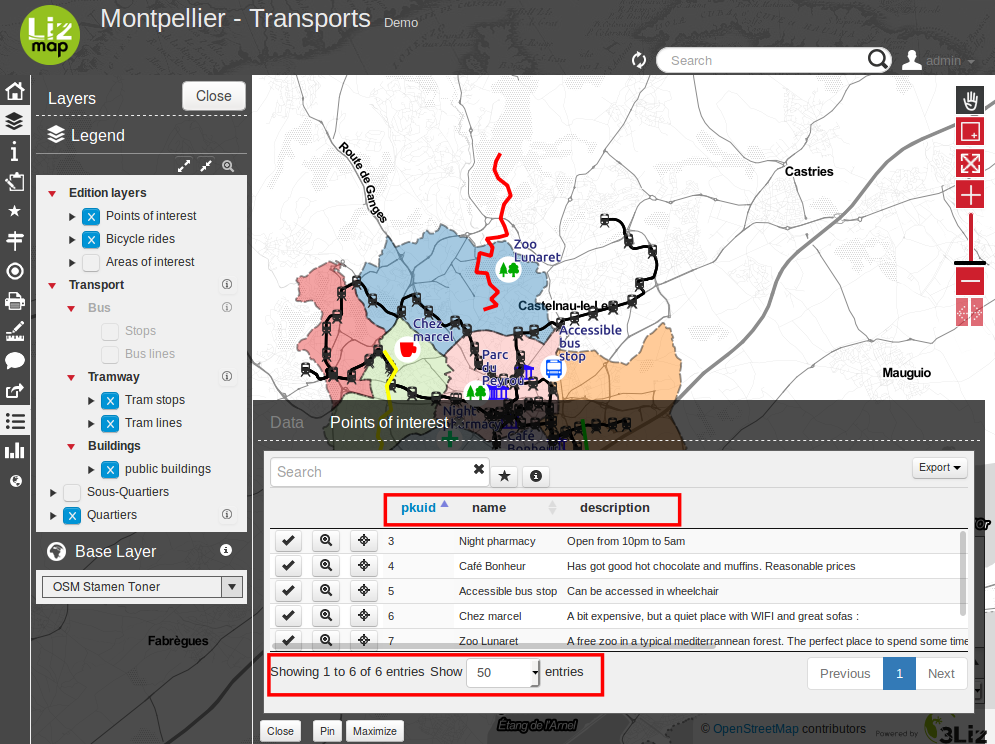
Description of the attribute table functionality
The layer data is shown in a paginated table. By default, the table shows 100 lines at a time. You can change this behaviour by using the list situated in the bottom left side of the tab content.
The table of data can be ordered by a field by clicking on the column corresponding to . If you click again on the column, the order will be reversed.
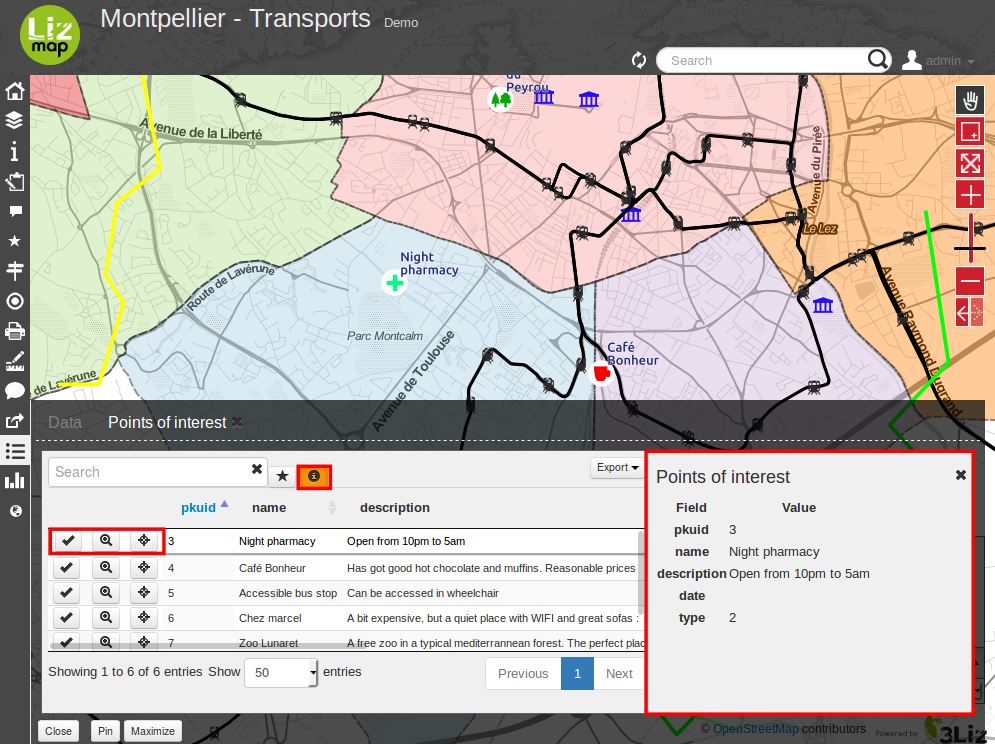
Actions on lines
When you click on a table line, the line will be displayed with a border to help viewing which line is highlighted.
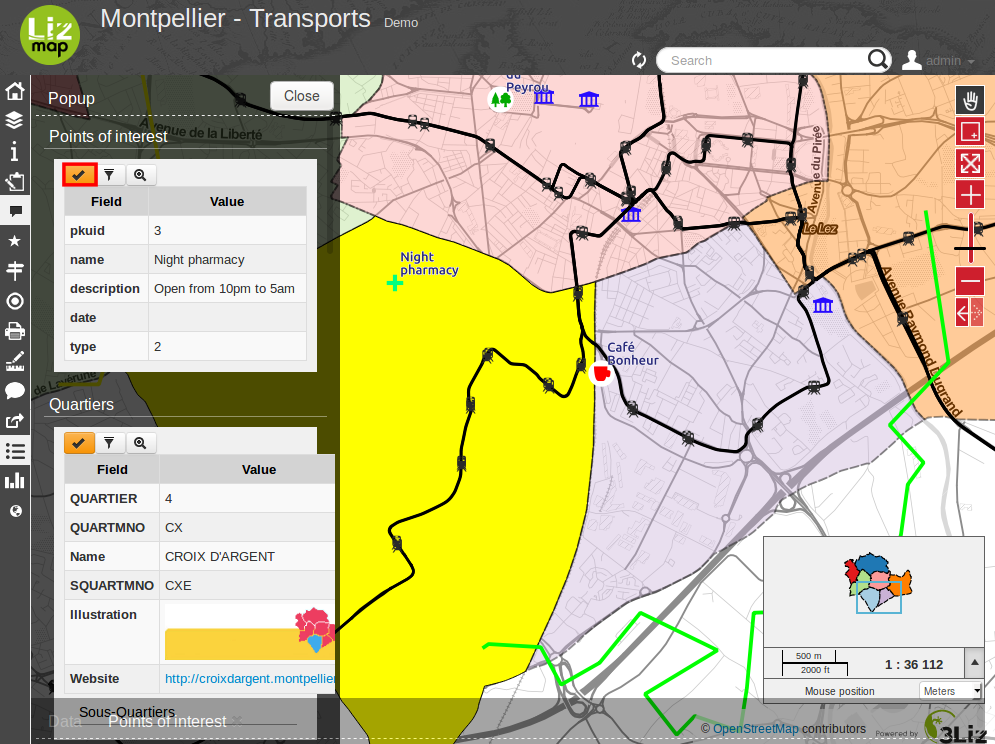
If the publisher has enabled the popup for the layer, you will be able to see the content of the popup for the highlighted feature by clicking on the (i) button (labelled with Display info when hovering the mouse on it). This will open a panel right to the table, which will display the detailed information on the highlighted table line. Furthermore:
Clicking on another line will refresh the right panel content with the new highlighted feature.
Clicking back on the (i) button or on the cross situated at the top right side of the information panel will hide the panel.
Each line of the table shows some buttons at the left side:
Select button : when clicked, the corresponding feature is selected. You can select many lines by using this button on different lines. The selected features will be displayed in a different style on the map, usually with a Yellow color. You can click again on the «Select» to unselect a selected feature.
Zoom button : clicking on this button will zoom to the corresponding geometry in the map. The scale will be chosen so that the feature geometry uses most of the available space.
Center button : clicking on this button will just pan the map to the corresponding feature, without changing scale.
More about selection tools
You can also select a layer object by displaying the popup for this object (if the map publisher has enabled the popup for the layer, a click on the map will show a popup window containing detailed information on the clicked feature). Inside the popup, if you can see the select button, you can use it to select only this object. Previous selection will be replaced by only this object.
When one or more lines have been selected in the attribute table (they become yellow), you can use the black «arrow up» button situated above the table to move the selected lines at the top of the table.
You can unselect all the selected objects by clicking on the «white star» button situated above the table.
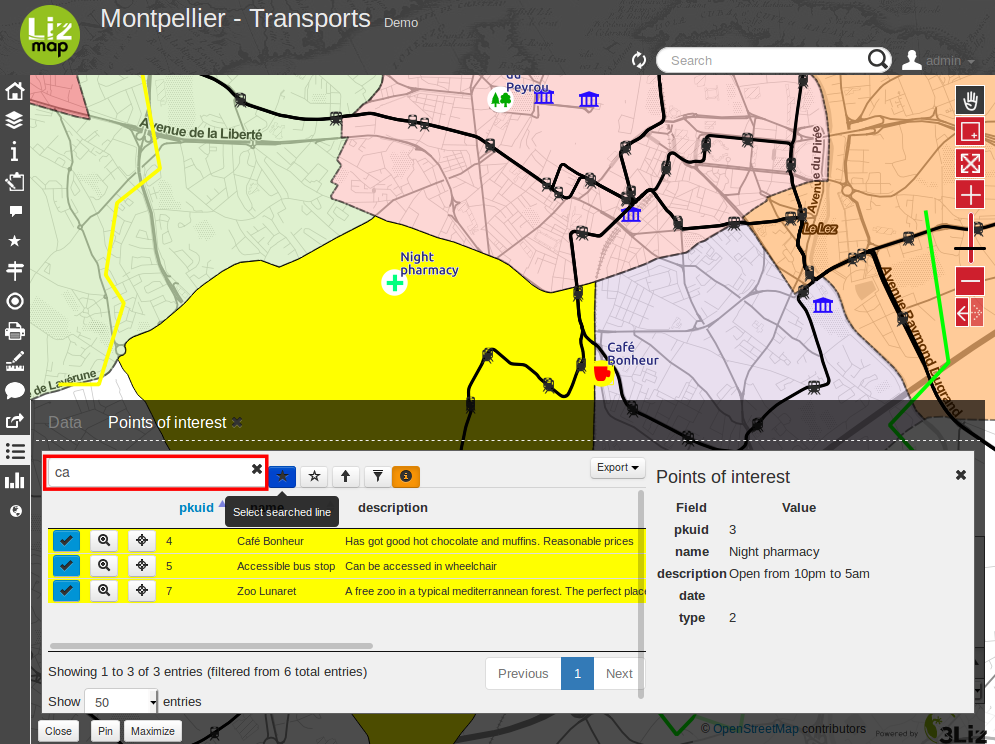
Quickly search through data
You can filter the lines displayed in the table by entering some letters in the Search field situated at the top left side of the tab content. If you want to see all the features again, just erase the search field content manually or by clicking on the cross button situated inside the field.
The text entered in the search field launches a search among the data for all the fields of the table.
Note that only the content of the table will be restricted to the lines matching your textual search. The objects on the map will not be filtered dynamically (but you could use select and filter to do so, see below)
Once you have filtered some data in the attribute table by entering some text in it, you can easily select them all by clicking on the «black star» button labelled «Select searched lines». This will select all the corresponding objects in the attribute table (display them in yellow) and also change their color in the map (usually in yellow too, depending on the configuration done by the map publisher)
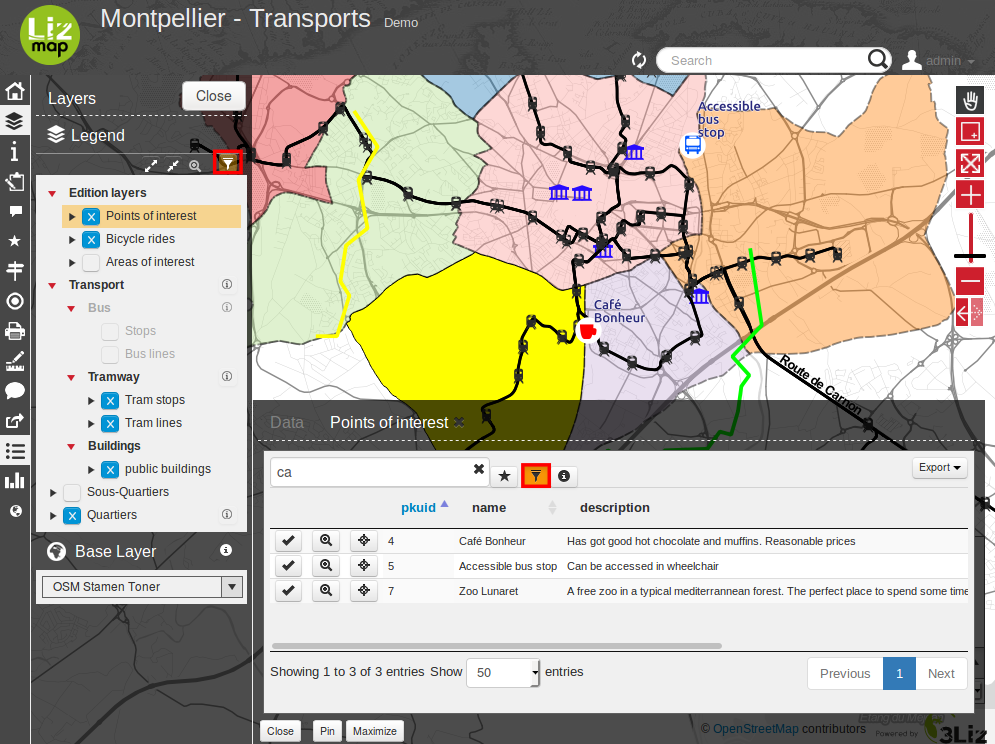
Filter data
When you have selected one or more objects in the layer attribute table, you can then filter the data displayed in Lizmap for this layer. To do so, just click on the «Funnel» button labelled «Filter» situated above the table (only available if some the selection contains at least one object).
Filtering will have the following consequences:
The attribute table will show only the filtered data
The Search input field will allow to search only among filtered data
The map will show only the filtered objects
The child layers linked with relations (and also published in the attribute table tool) will be filtered too. We call it «cascading filtering». For example, the bus stops could be filtered automatically if you have filtered one bus line, to show only the ones served by the filtered line.
The filtered layers will be marked in the left panel legend with an orange background, and a new orange «Funnel» button will be displayed above the legend.
You can cancel the filter to go back to previous state:
by clicking on the orange «Funnel» button at the top of the legend in Lizmap left panel
by clicking back on the filter button just above the attribute table concerned by the filter
When exporting the map view with the permalink tool (situated in the menu bar), the filter will be activated in the linked map and the users won’t be able to easily unfilter the data : the unfilter button will not be displayed in Lizmap interface The only way would be to remove the filter parameters from the permalink URL. This is not a safe way to protect some data, but a way to focus on some data only.
More complex scenarios : relations between layers
todo