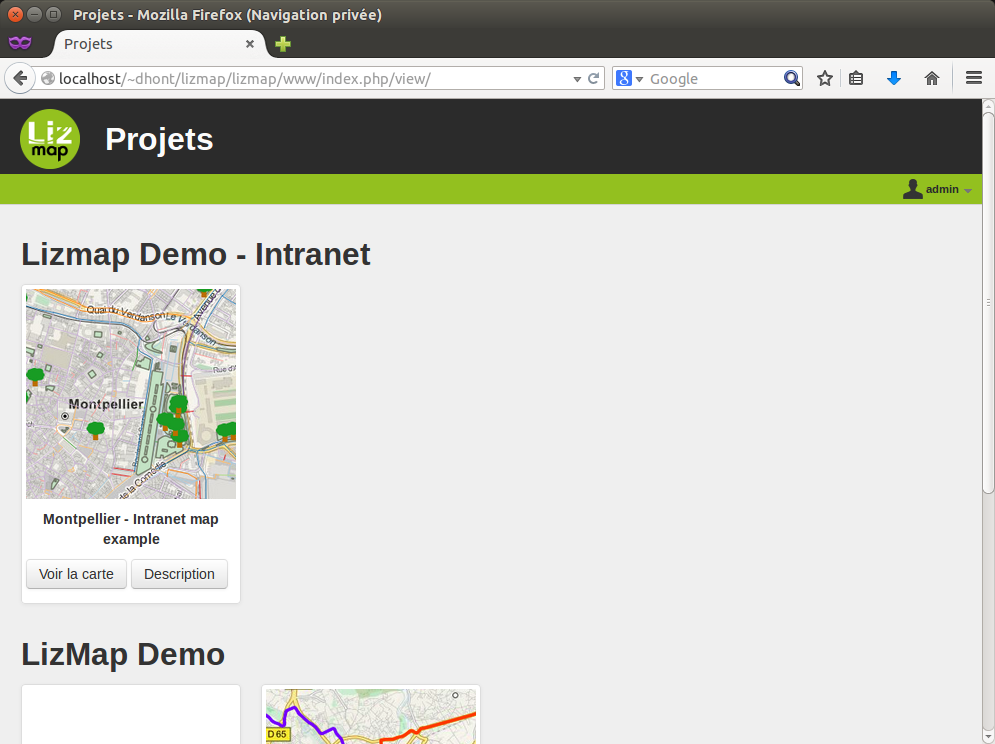
Projektien sivut
Oletusksen Lizmap sivu tarjoaa luettelon kartoista järjestettynä hakemistoittain.
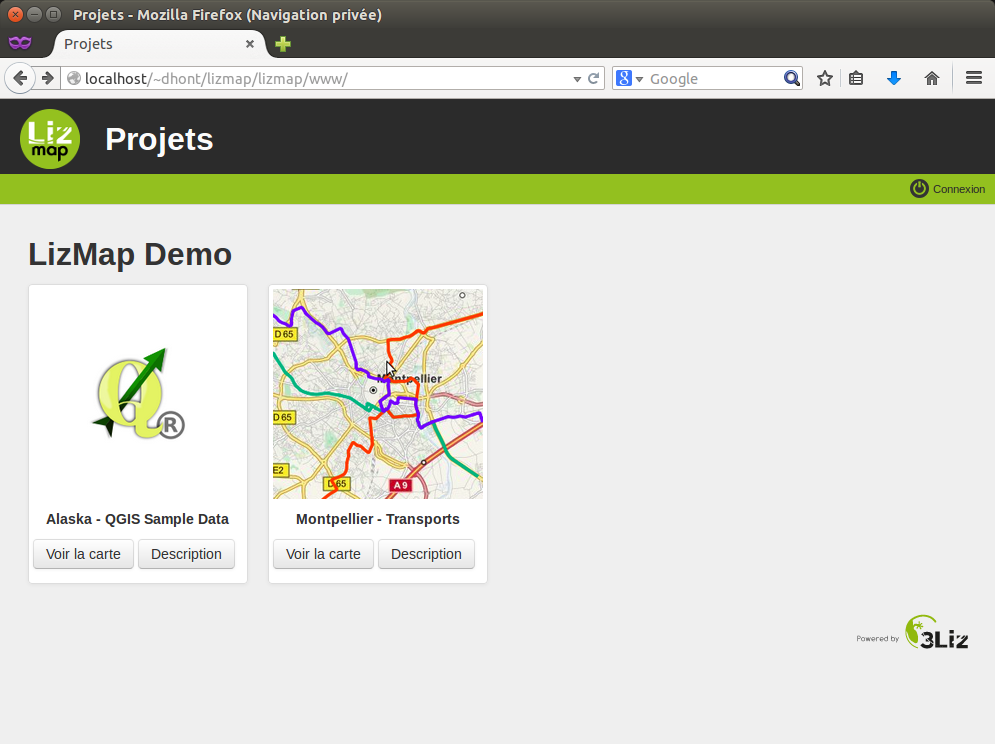
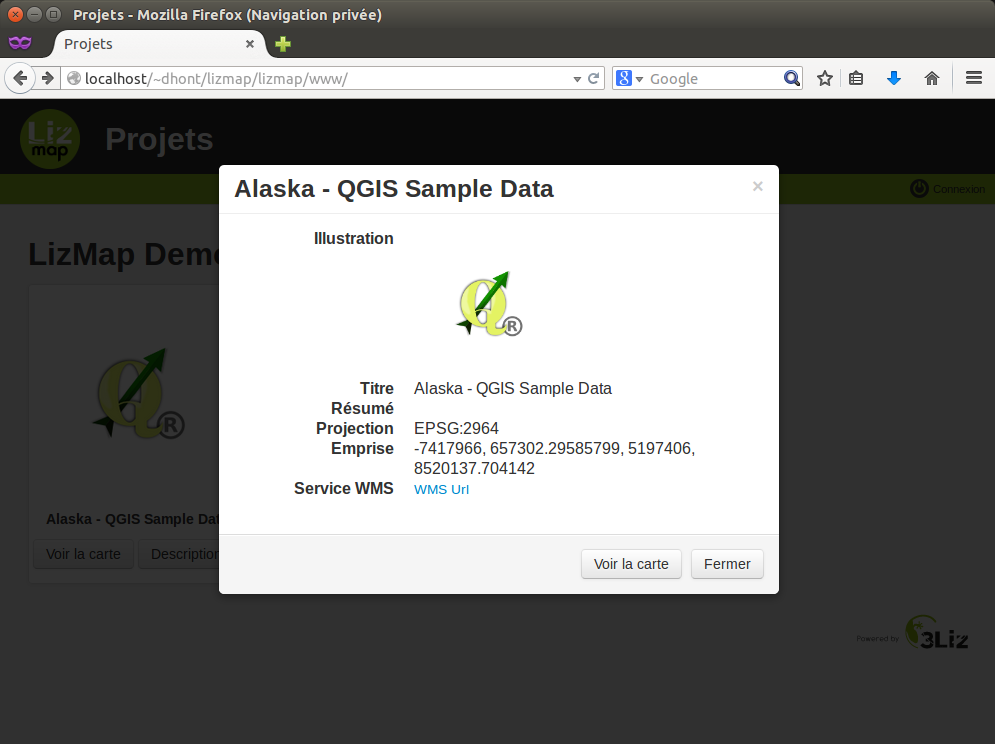
Voi avata kartan tietosivun. Nämä tiedot tulevat suoraan QGIS projektista,
Kartan avaaminen tehdään joko klikkaamalla**Lataa kartta** tai kuvasta joka on projektin mukana.
Yksinkertainen kartta
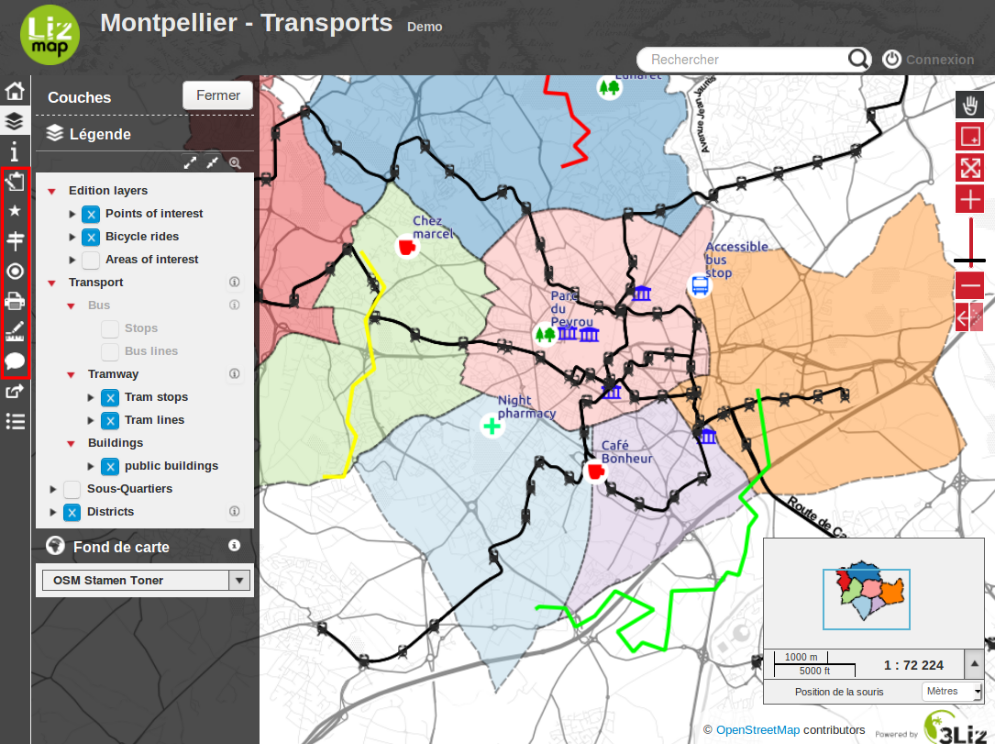
Lizmap sisätää oletuksena verkkokartoissa seuraavat ominaisuudet:
panorointi
käyttäjän rajaaman alueen zoomaus
lisäzoomaus
zoomaustason valinta tasopalkista
zoomauksen vähentöminen
mittakaavan näyttö mittakaavajanalla ja numeerisesti
Tasojen järjestys ja rakenne tasopanelin hallinnassa vastaa QGIS karttajulkaisijassa määritettyä.
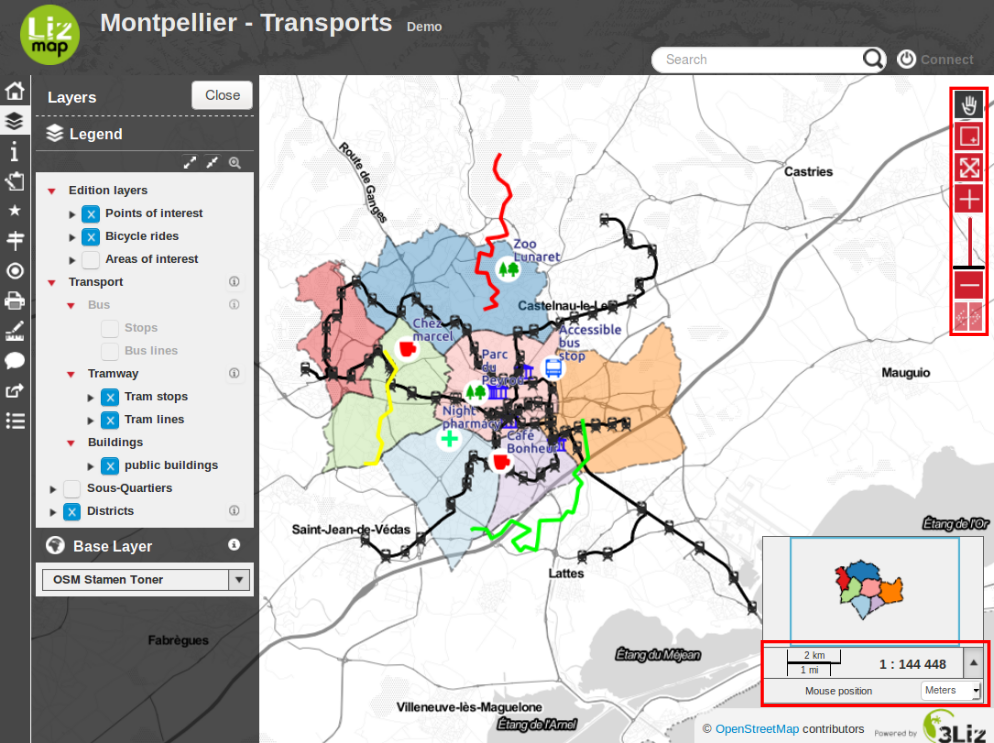
Zoomaus ja panorointi ovat saatavilla kartan oikeasta laidasta. Alueen zoomaamiseksi tulee Sinun valita ”zoomaa suorakulmiolla” ja piirtää vetäen suorakulmio määritellen haluamasi alue.
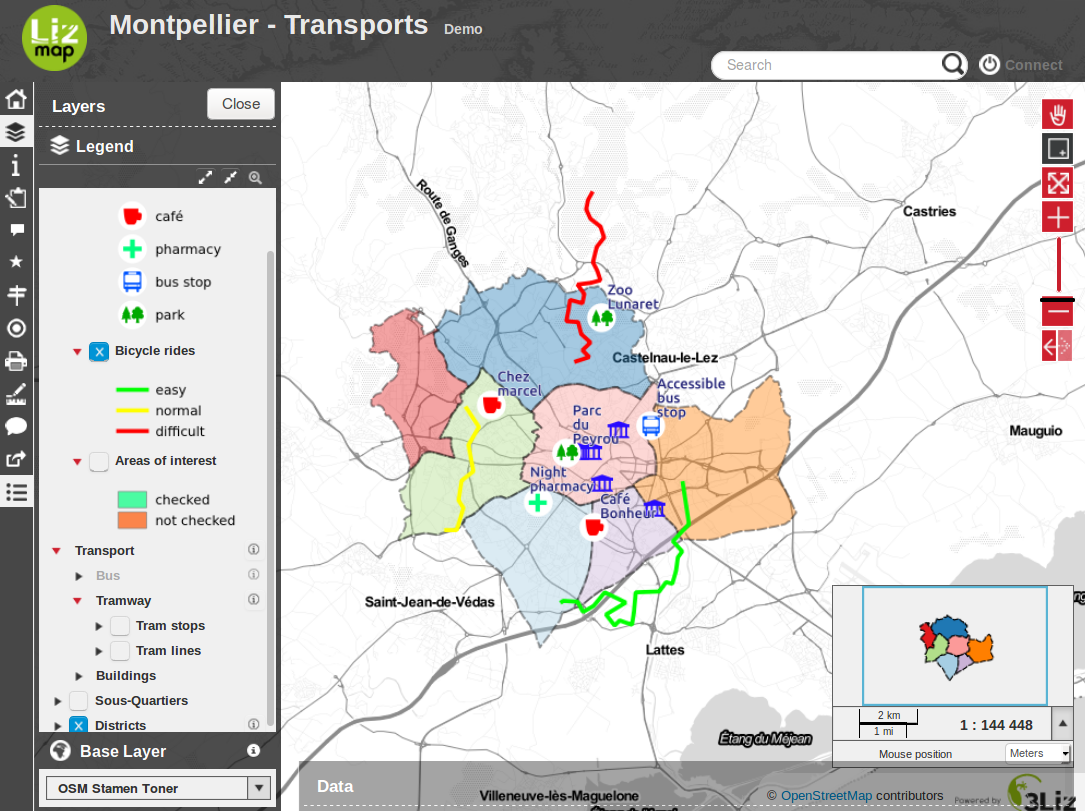
Voit käyttäen ”kolmiota” vasemmalla tason otsikossa ja saada esille tason selitteen.
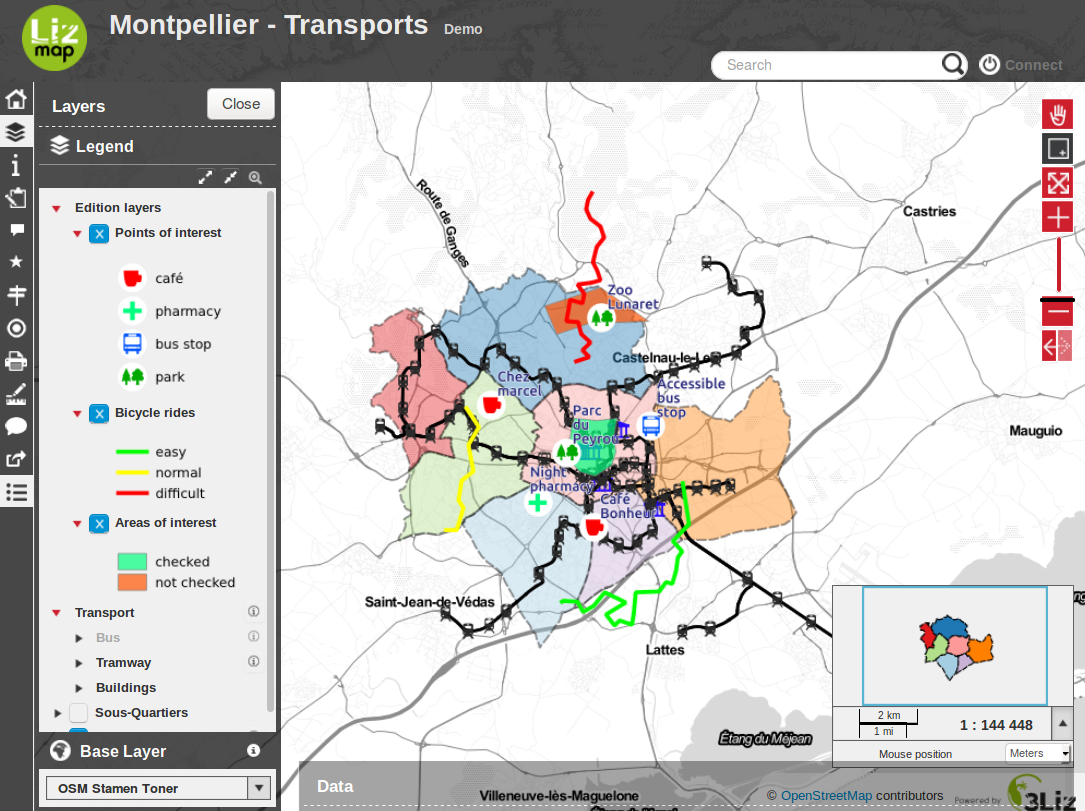
Valintalaatikot mahdollistavat Sinun piilottaa ja tuoda esille ehdotetut tasot.
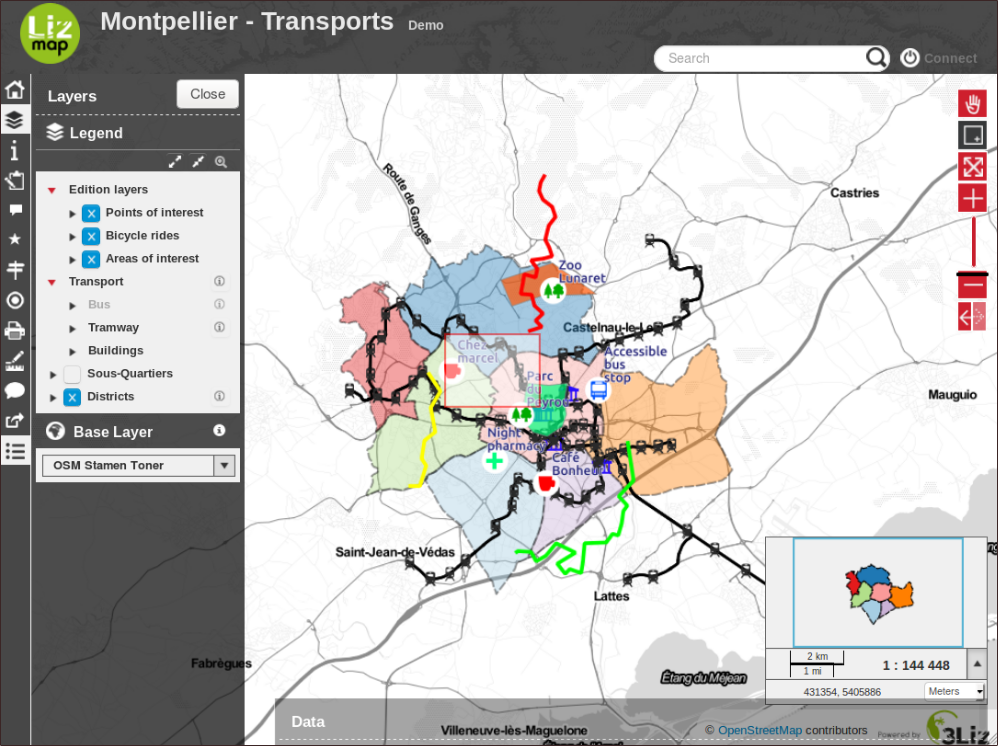
Saadaksesi kaiken hyödyn kartasta, voit piilottaa paneelin hallintatasot.
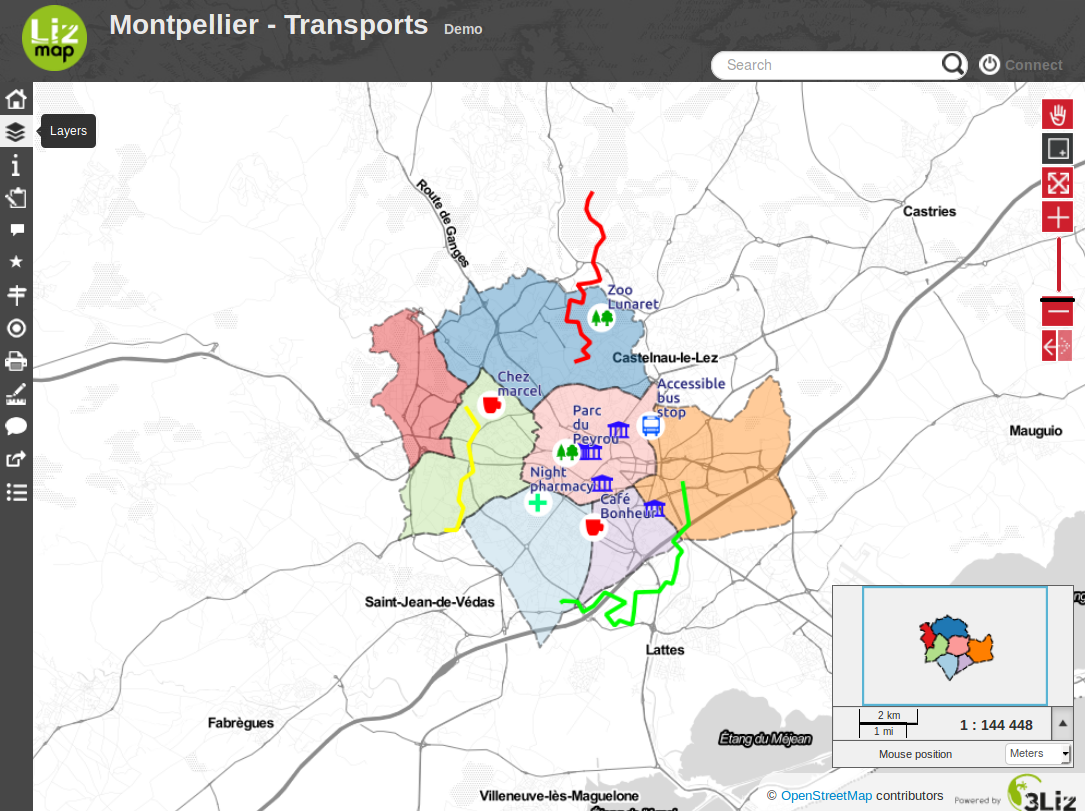
Lopuksi voit:
palataa projektien sivulle
näyttää kartan tietosivun
Todentaminen
Ylläpitäjä voi rajoittaa pääsyä joillekin karttaryhmille. Päästäkseen näille karttaryhmille tulee Sinut todentaa oikeutetuksi. Todentamiseen pääsee näppäimen ”Yhdistä” kautta ylhäällä vasemmalla.
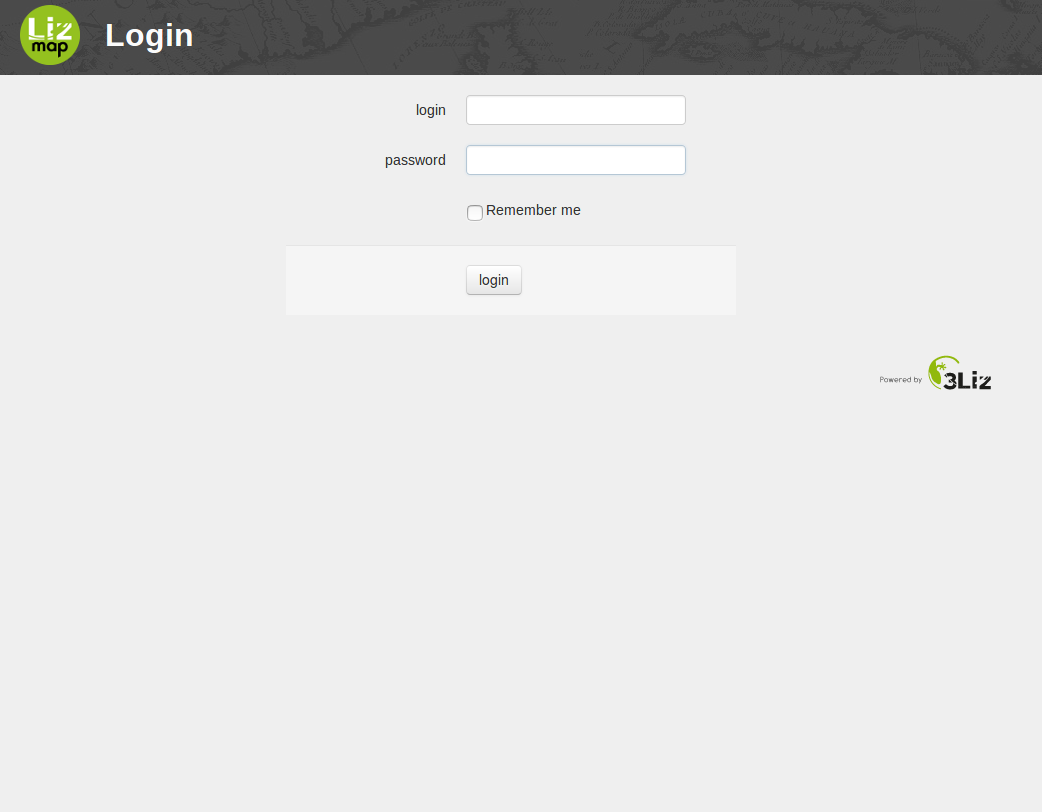
Kun todentaminen käytössä, riippuen oikeuksistasi, pitäisi Sinun päästä uusiin karttoihin.
Voit kirjoittautua ulos sekä muokata käyttäjätietojasi.
Edistyneet ominaisuudet
Kartan julkaisija voi lisätä eräitä ominaisuuksia riippuen tavoitellusta käyttäjän kokemuksesta:
peruskartan valinta
paikantaminen tason mukaan
etäisyyden, alan ja piirin mittaaminen
kartan tulostus
datan muokkaus
Peruskartan valinta
Käyttäen Lizmap liitännäistä muokkaaja on saattanut lisätä ulkoisia peruskarttoja tai tyhjän perustason kartalle. Nämä peruskartat ovat käytettävissä tasojen hallintapanelissa luettelona.

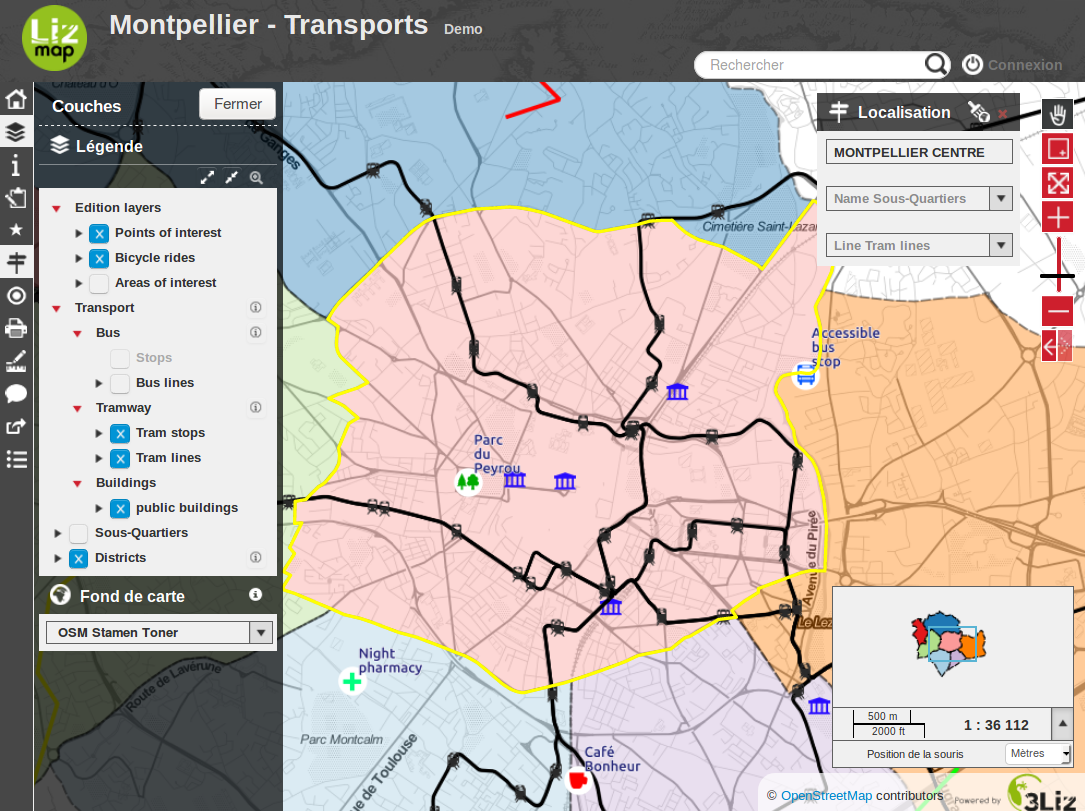
Paikantaminen tason mukaan
Tämä ominaisuus näytetään oletuksena jos kartan julkaisija on sen aktivoinut.
Se sijaitsee ylhäällä tasohallinanpanelissa ja on listan muotoinen. Joihinkin listoihin tulee antaa muutama kirjain ennenkuin se tarjoaa sijainteja.
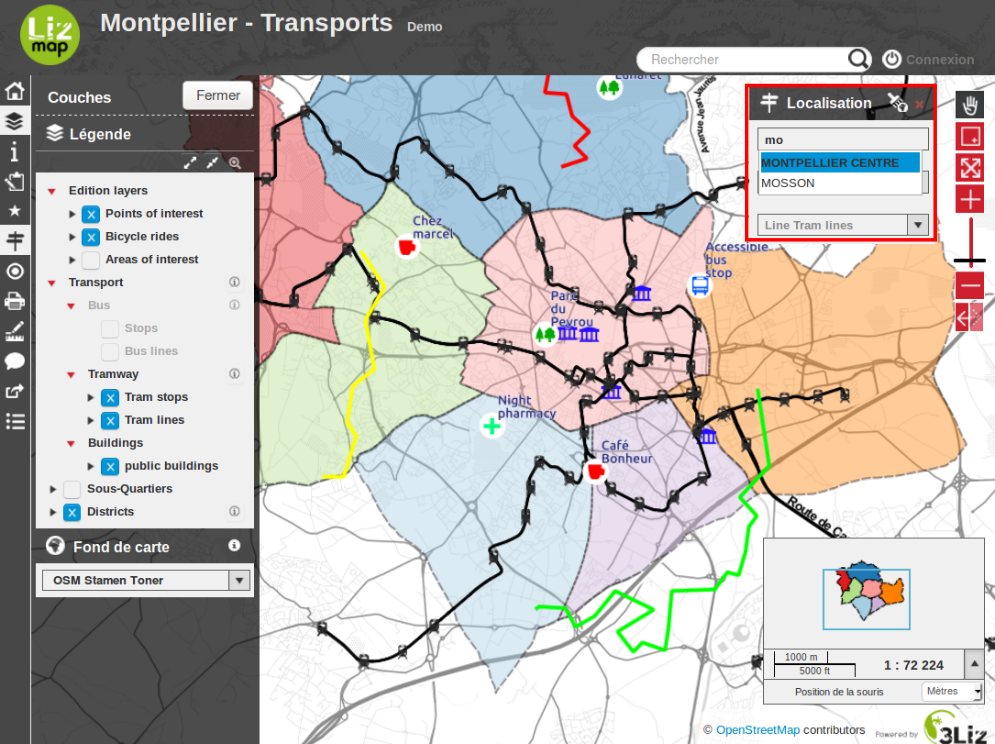
Tee yksinkertaisesti valinta listasta zoomataksesi jäseneen.
Mittaukset
Mittausominaisuudella voit laskea:
etäisyyden
alan
ympärysmitan
Se on käytettävissä Lizmapin työkaluvalikossa.
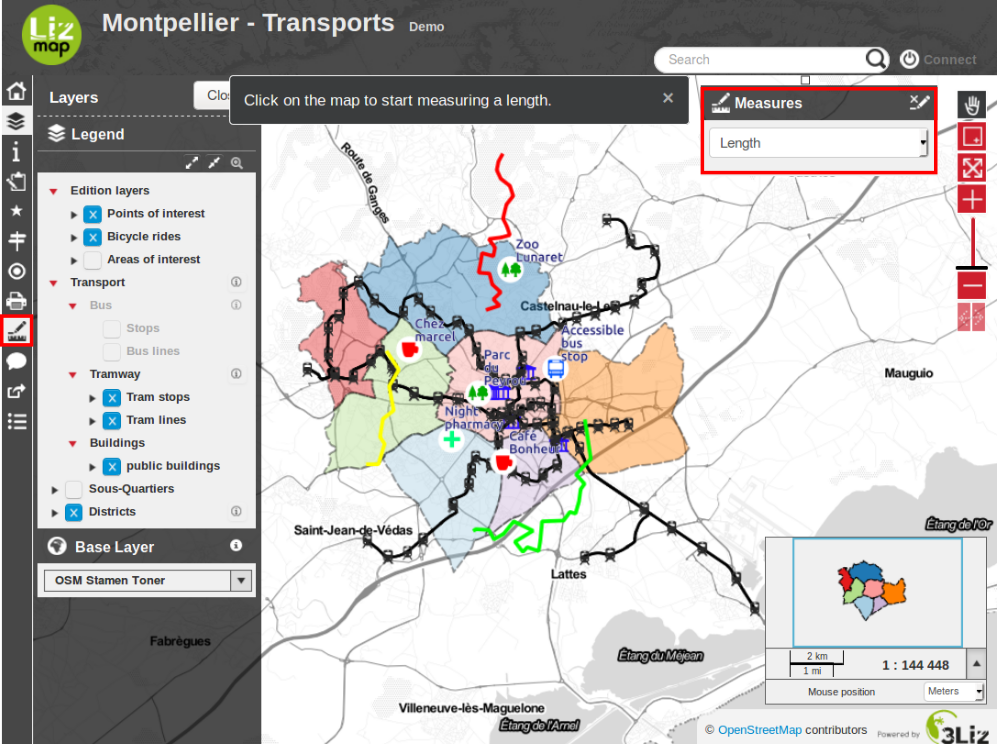
Työkalu aktivoidaan valitsemalla mittaustyyppi. Kun se on aktivoitu kertoo viesti mitä Sinun tulee tehdä.
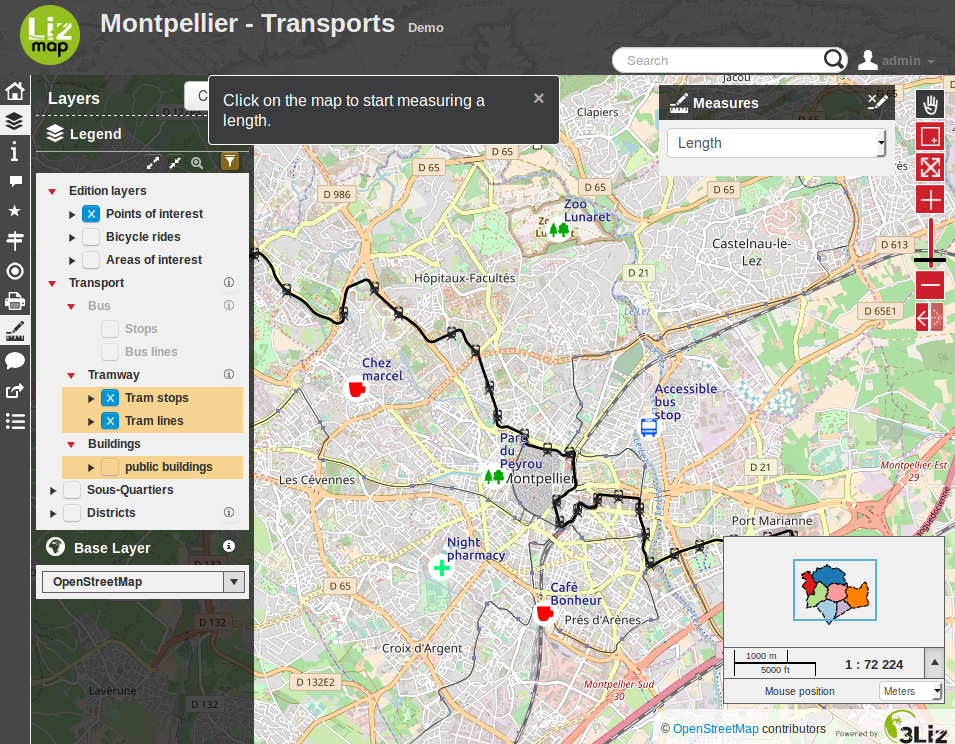
Mittaustulos näytetään tilapalkissa.
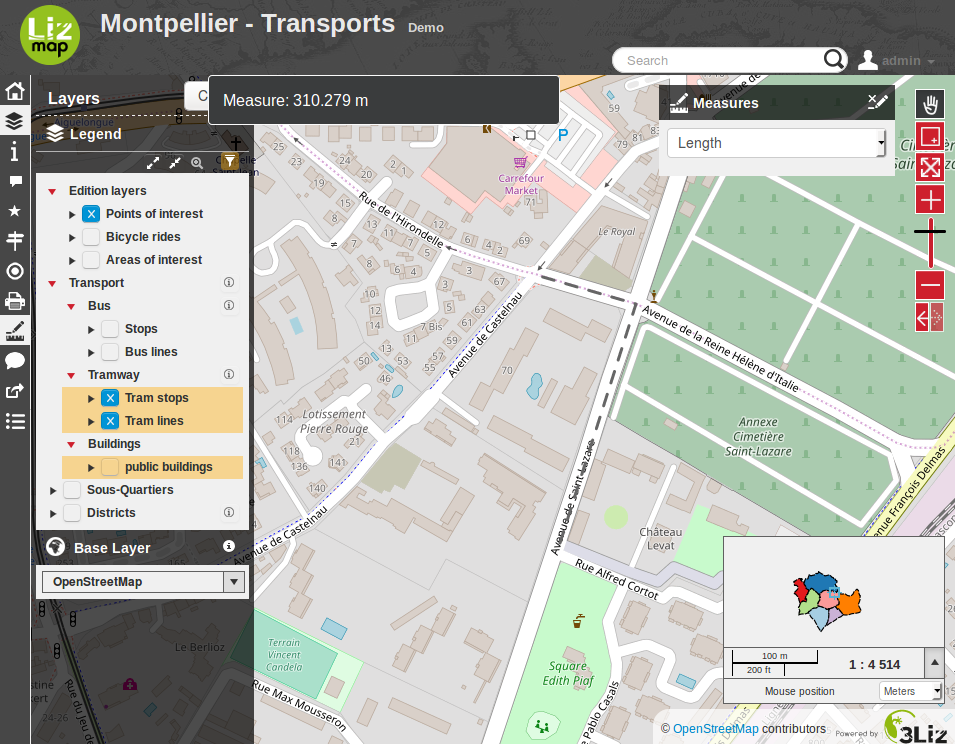
By double-clicking on the map, the measurement is fixed. To start over, you can click on the map and restart the measurement calculation.
In the feature bar, the button on the right allows to stop using it.
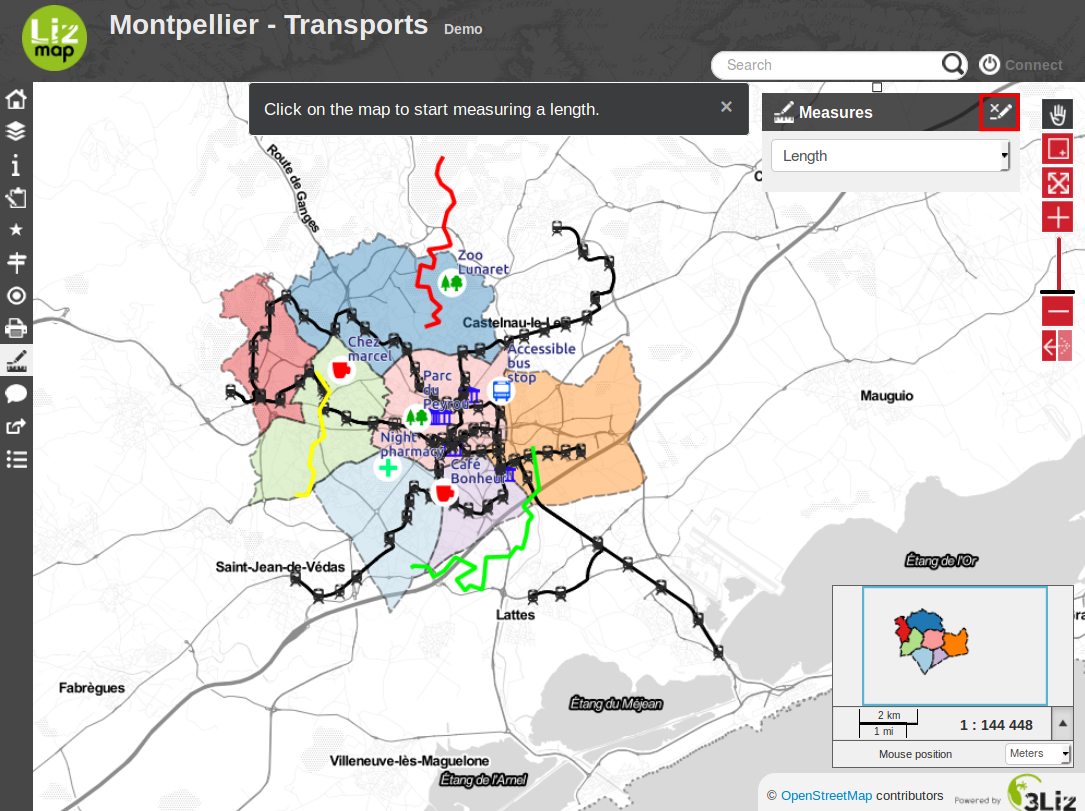
It is also possible to change the measurement functionality without having to stop the feature.
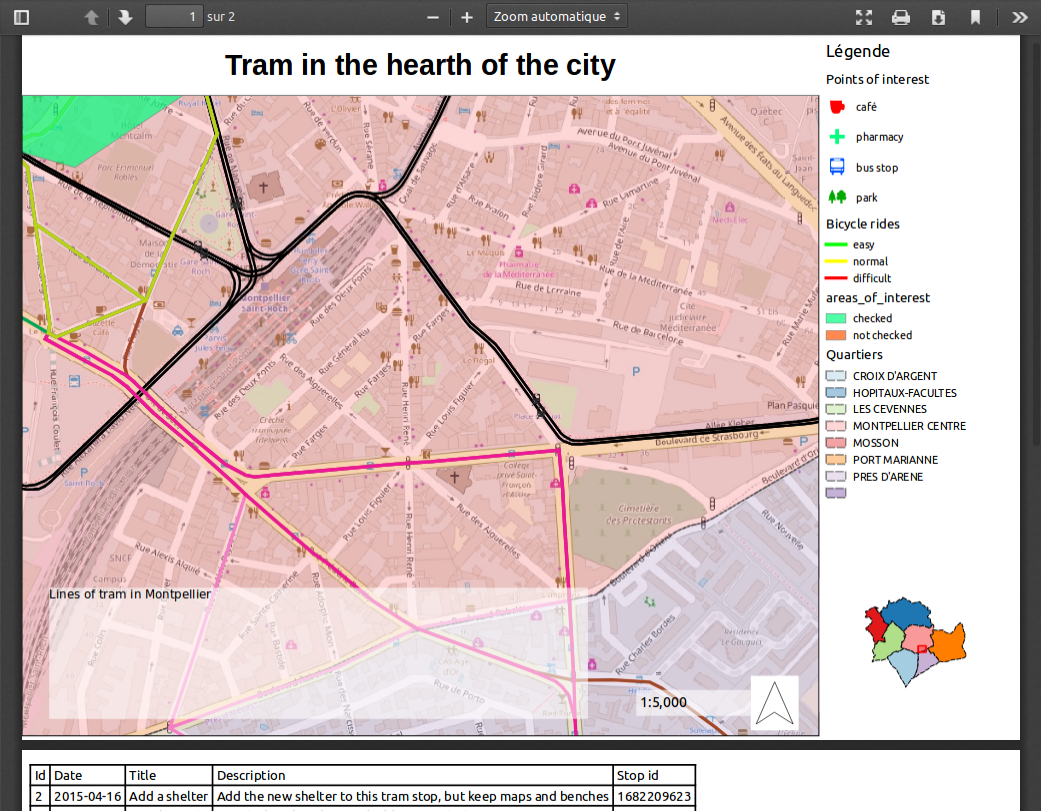
Tulostus
The print feature is available in the Lizmap menu bar. It depends on the number of print compositions published by the map publisher.
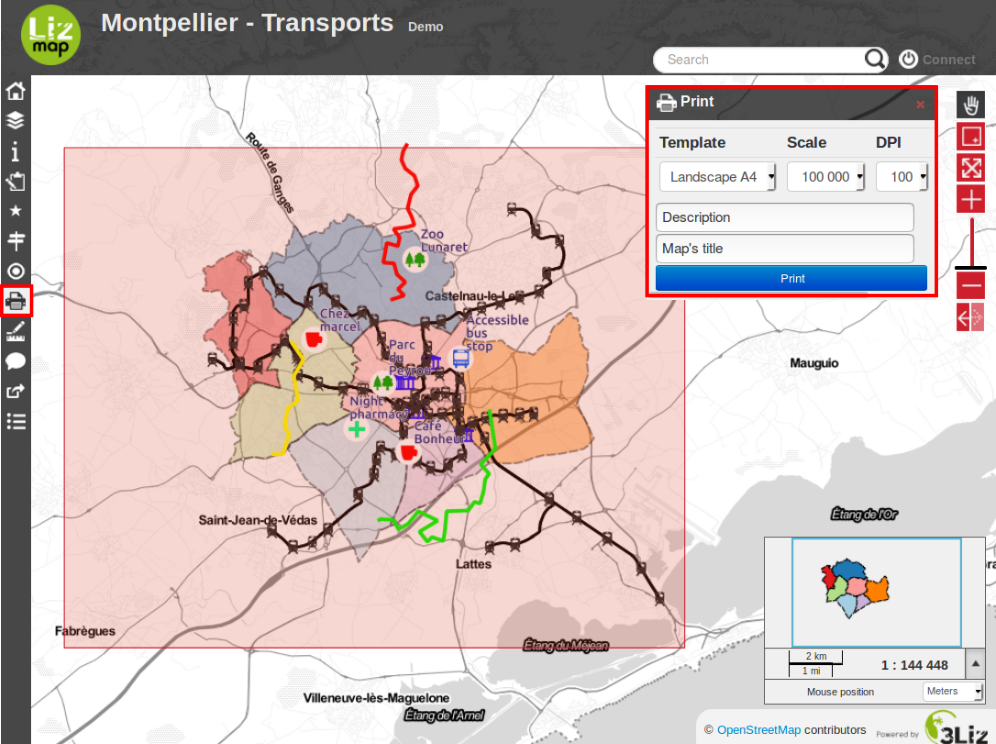
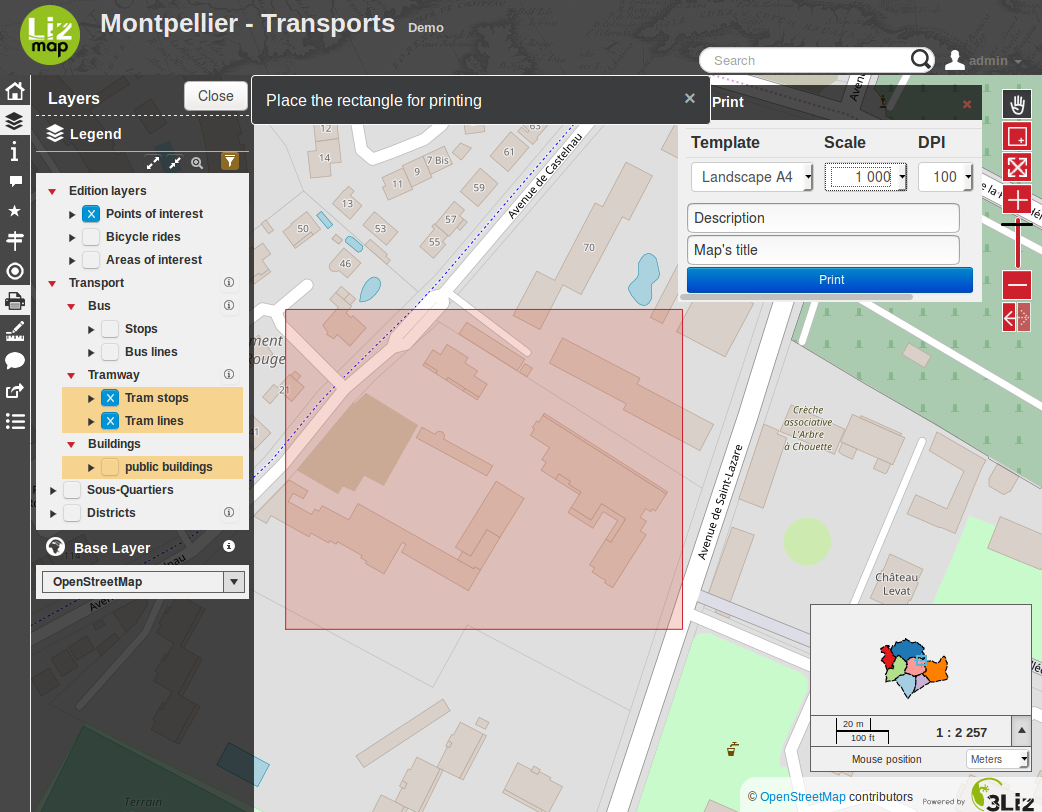
Once the feature activated, a print area with the form of the composition is displayed on the map. Use this area to define the area to be printed. You can move it.
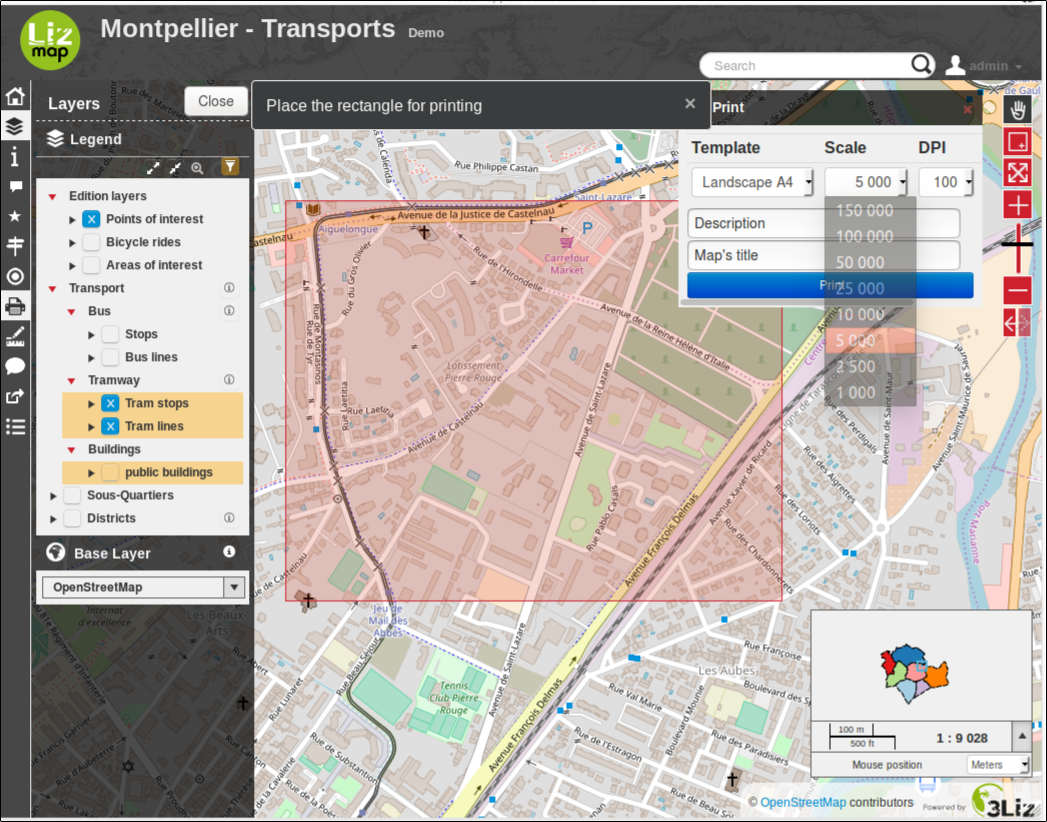
On the left, above the panel layer management, you can select the scale of printing.
Depending on the configuration of the printing composition, you can have the possibility to enter your own text.
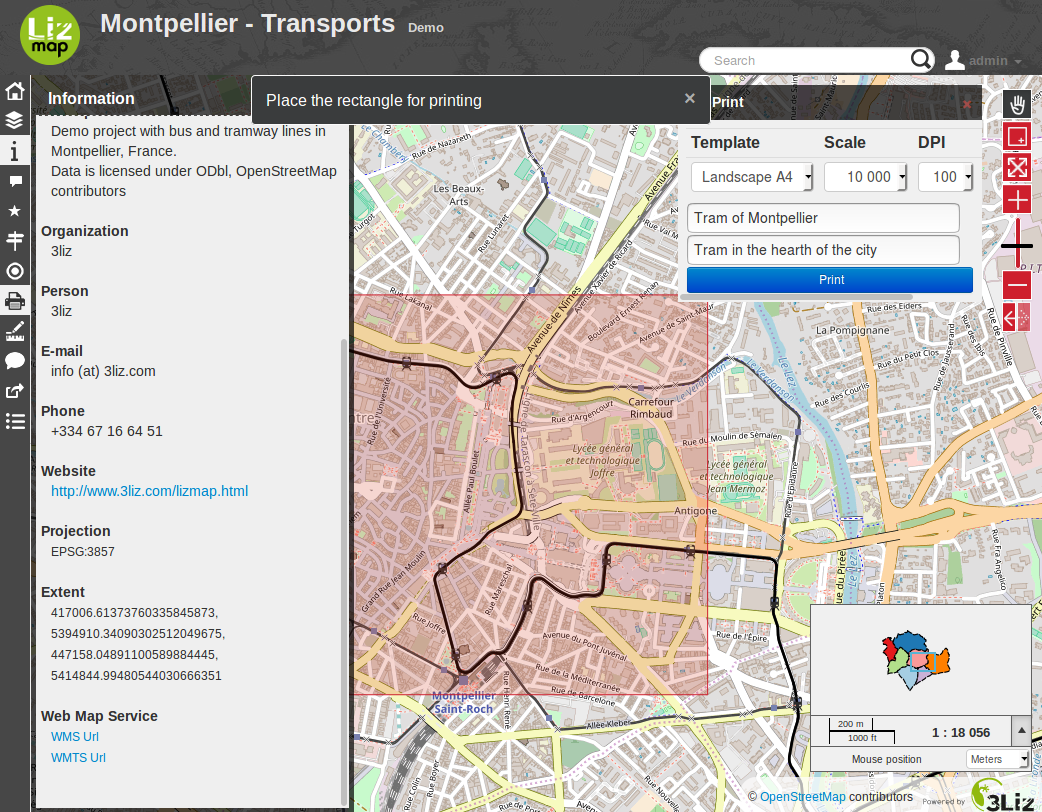
To begin building the print file, you can click on Print. You will get a PDF file with the layout defined by the map publisher.
Editing spatial data
The map publisher can allow users to edit certain data. It also has the ability to limit possible changes:
adding spatial object
geometric modification
fields modification
deleting spatial object
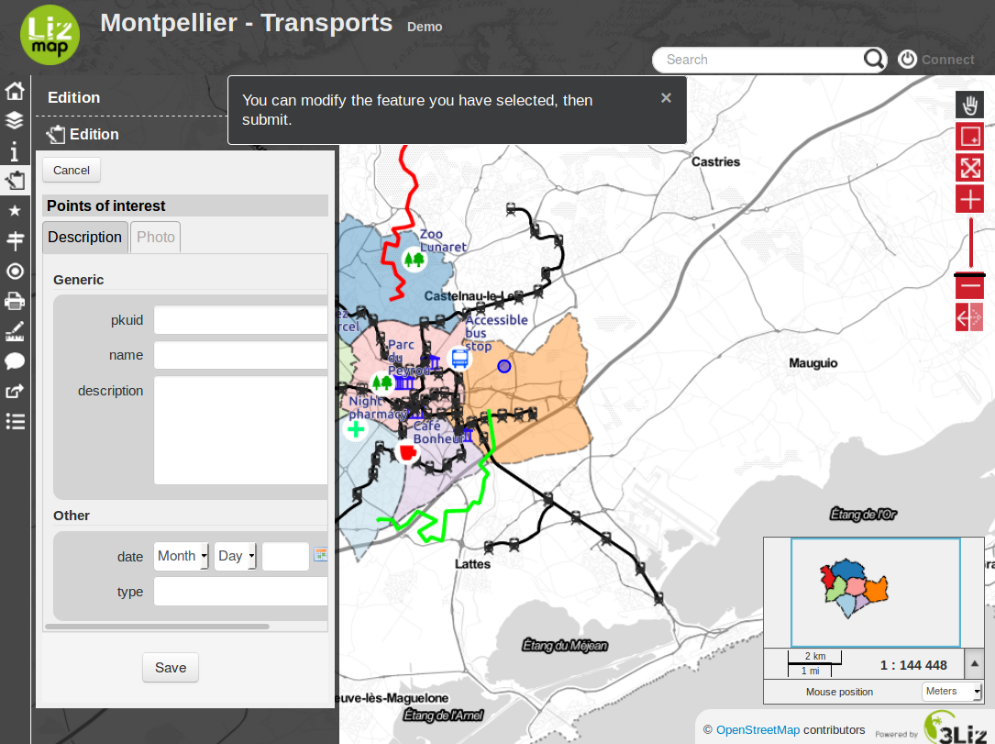
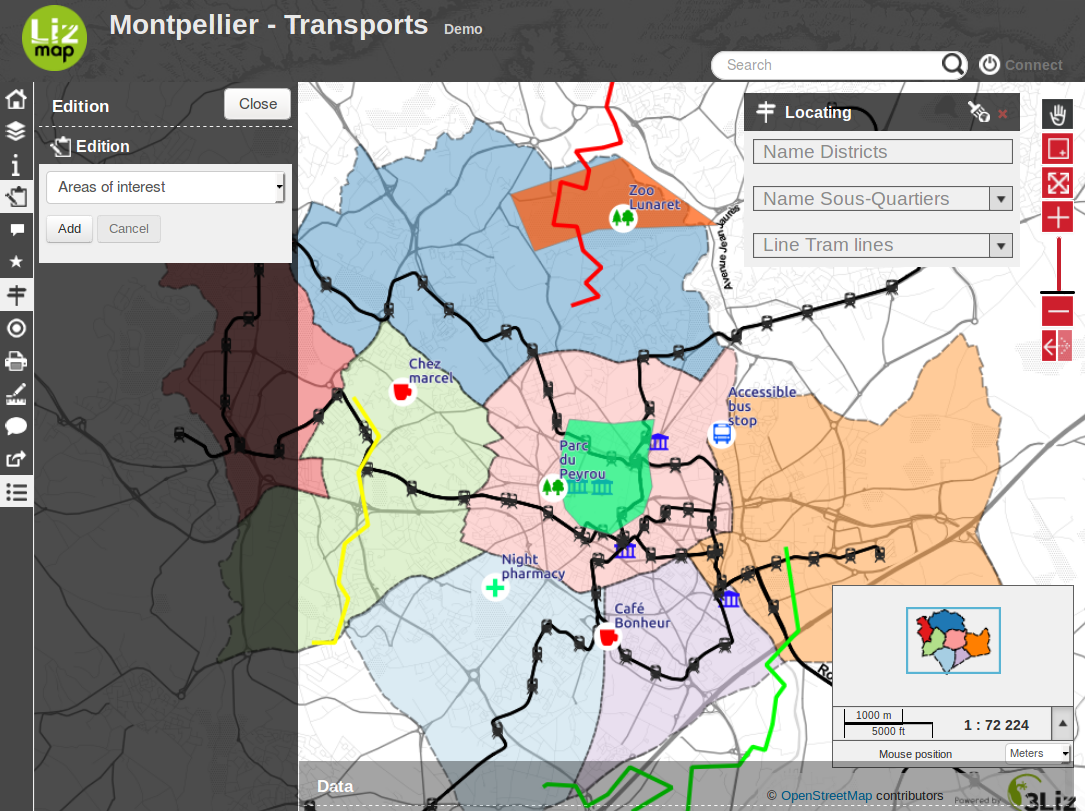
The feature is available in the Lizmap menu bar. The edit menu allows you to select the data you want to update.
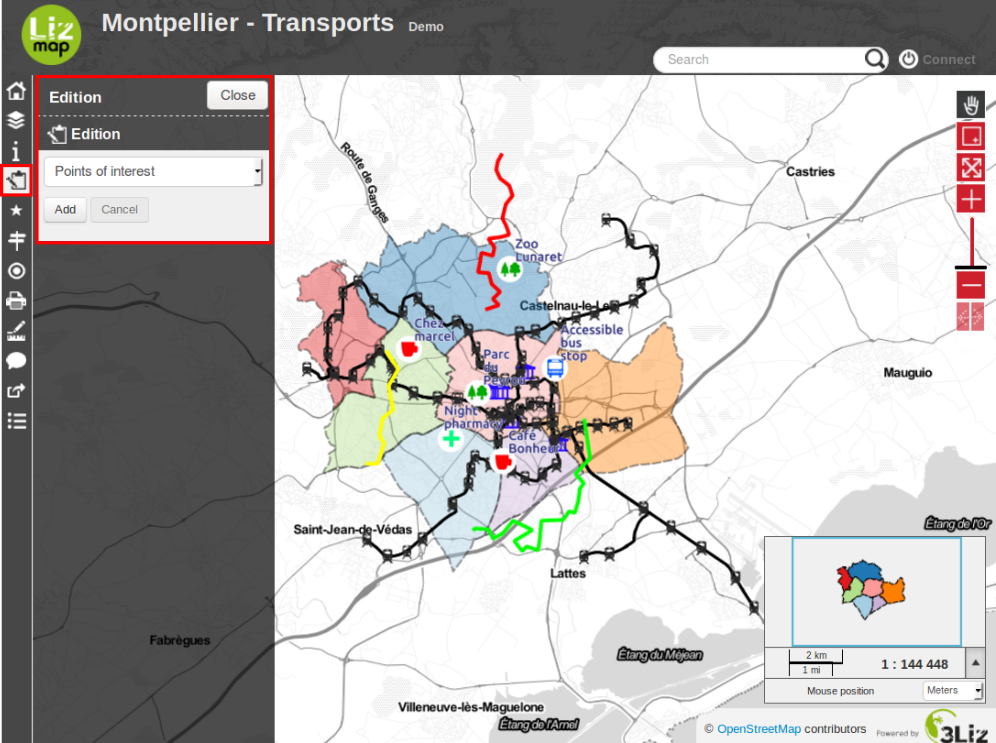
Once the layer selected, the edit pannel appears. This varies depending on the configuration desired by the map publisher. If any changes are available you have to choose between Add a new object or Select one.
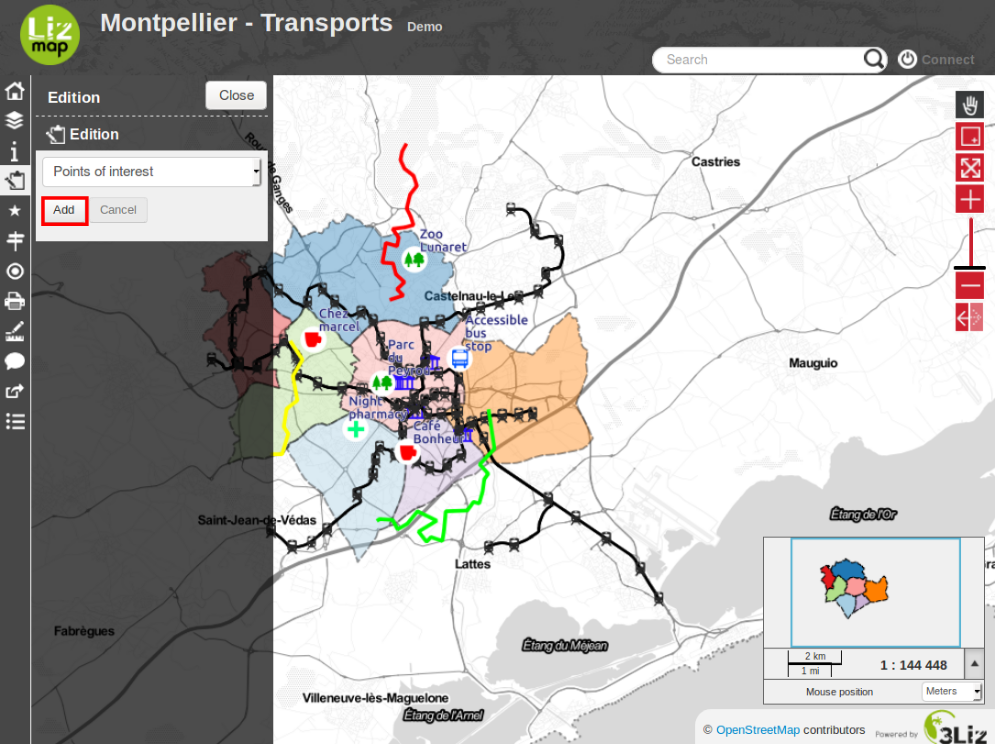
If you have selected Add, you will be asked to draw a simple form that depends on the selected data layer:
point
line
polygon
In the case of line and polygon, you need to click several times to draw the shape you want.
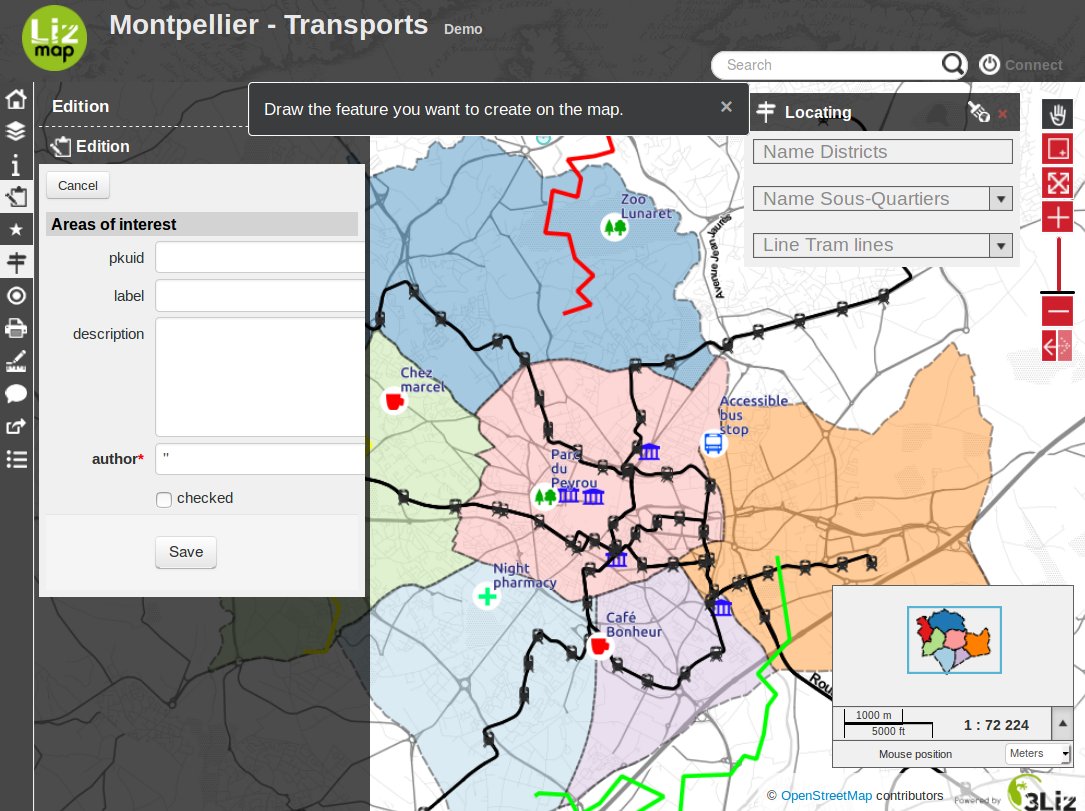
To finish your line or your polygon you must add the last point by double-clicking the desired location. Once drawing finished, an editing form for fields will be displayed.
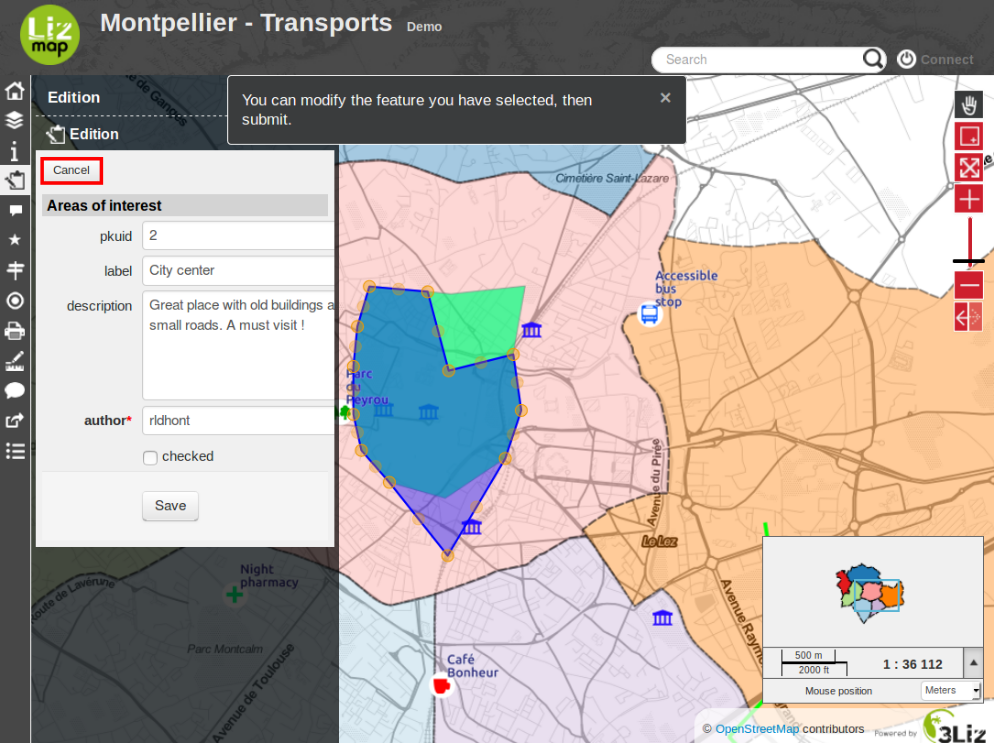
If you want to restart drawing the geometry, you should click Cancel.
If the geometry is right for you and you have entered the required information, you can Save. The new object will be added. You will be able to update it by selecting it.
To select an object to update, you will need to click on it on the map then click on the button Edit.
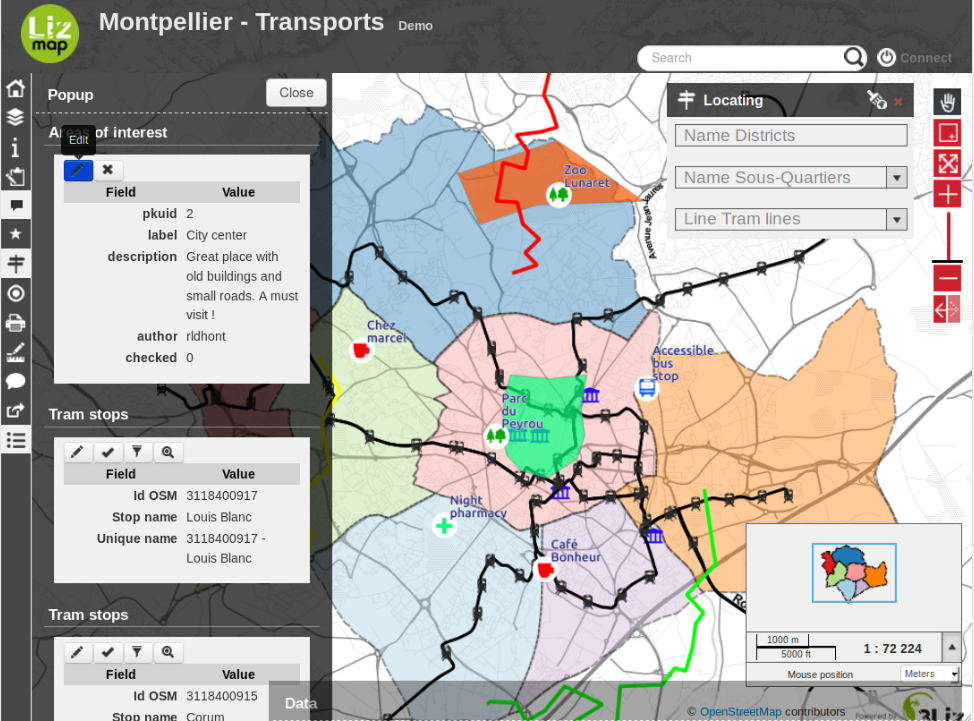
The selected object appears on the map and its geometry may be changed immediatly.
You can undo geometry changes using the Cancel button.
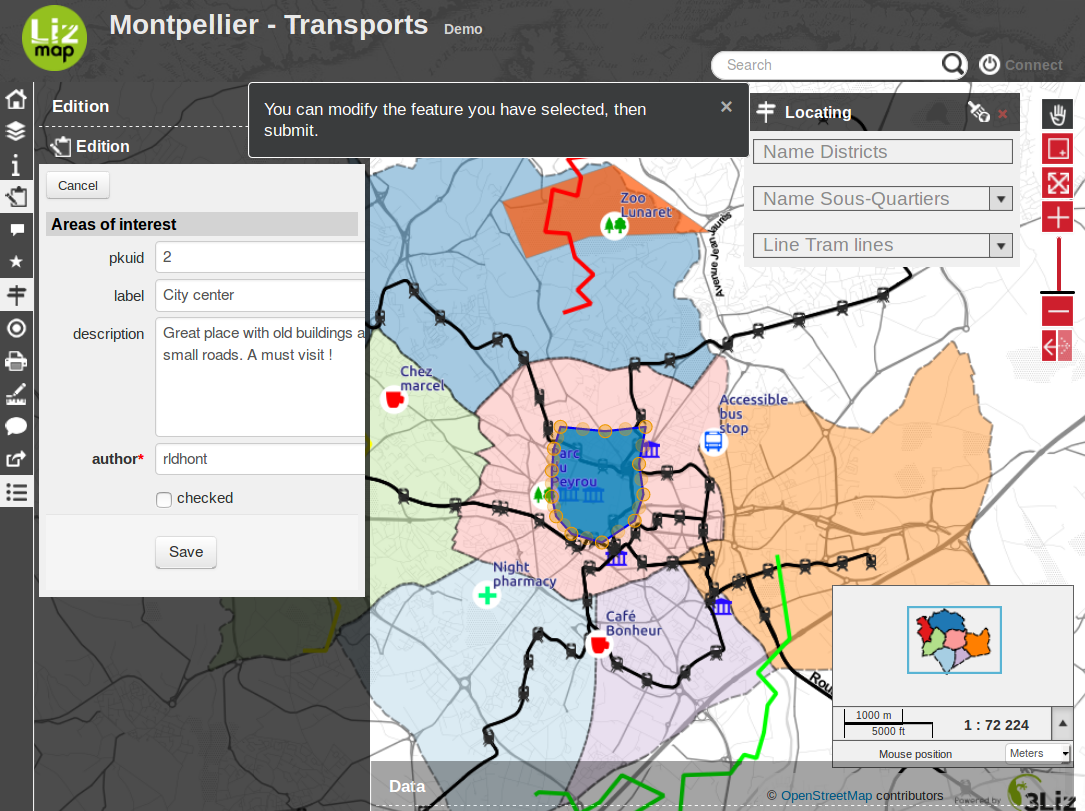
To validate your geometry modifications or simply access the editing form for fields, you must click Save.
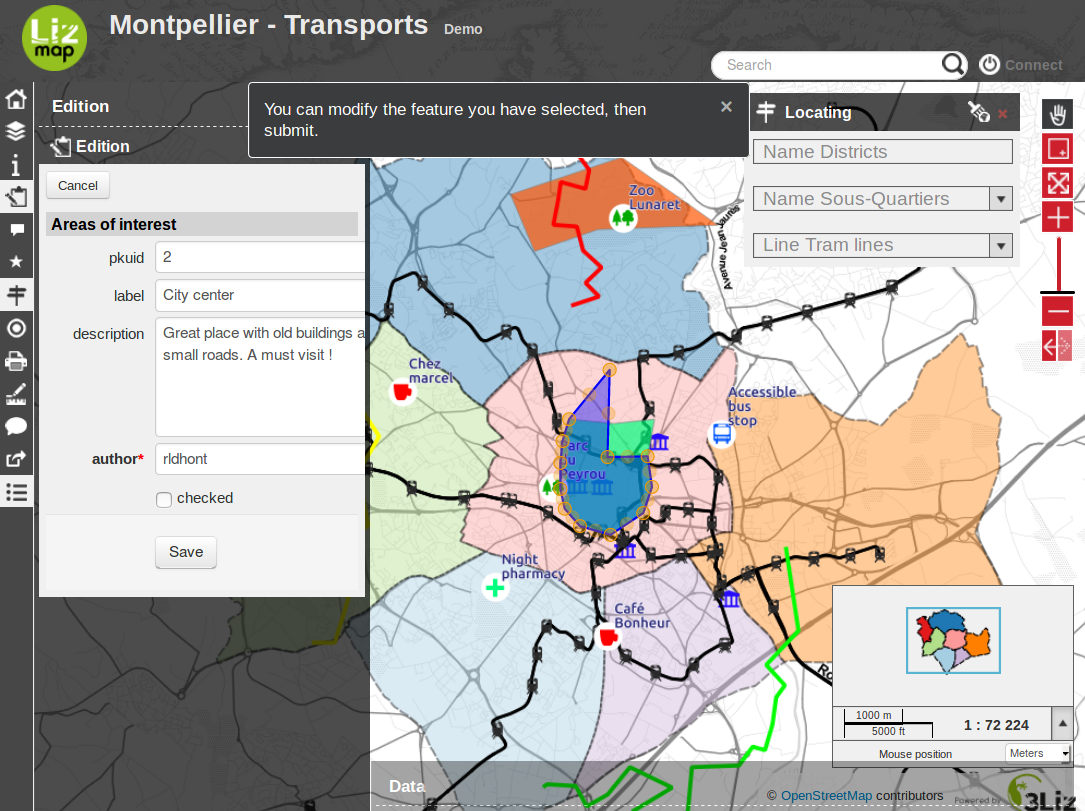
A dialog box containing the editing form for fields of the object appears.
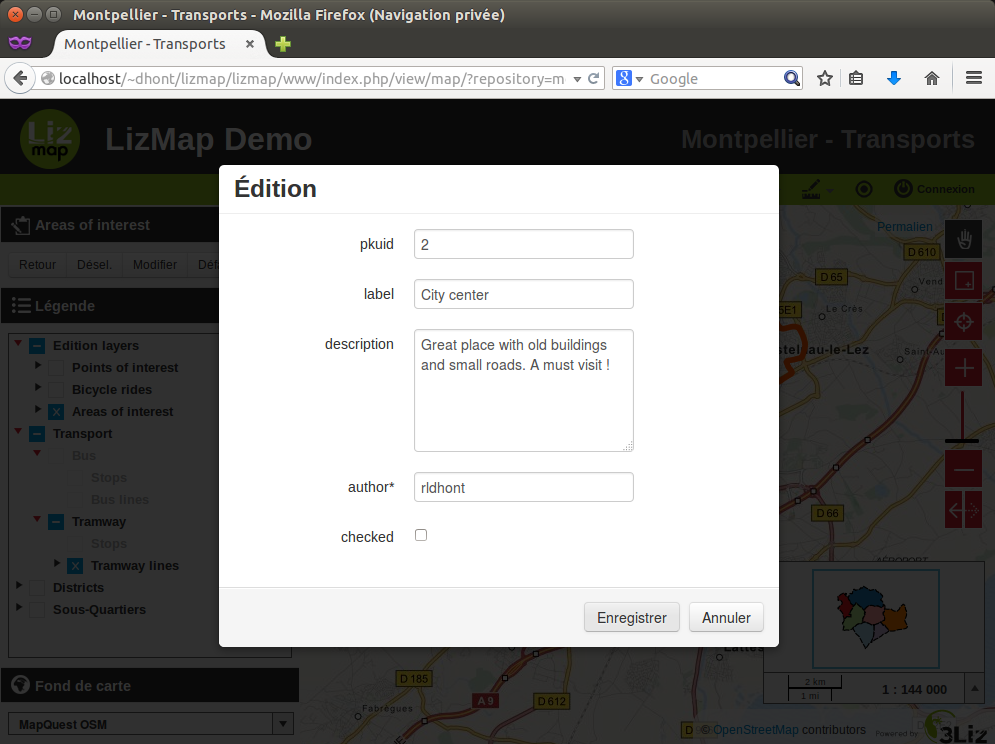
The Save button saves the geometry and attributes changes.
If you want to remove the object you selected, you must click Del.
Finally, to disable editing tool, simply click on Close or click again on the Edition icon.
Attribute layers
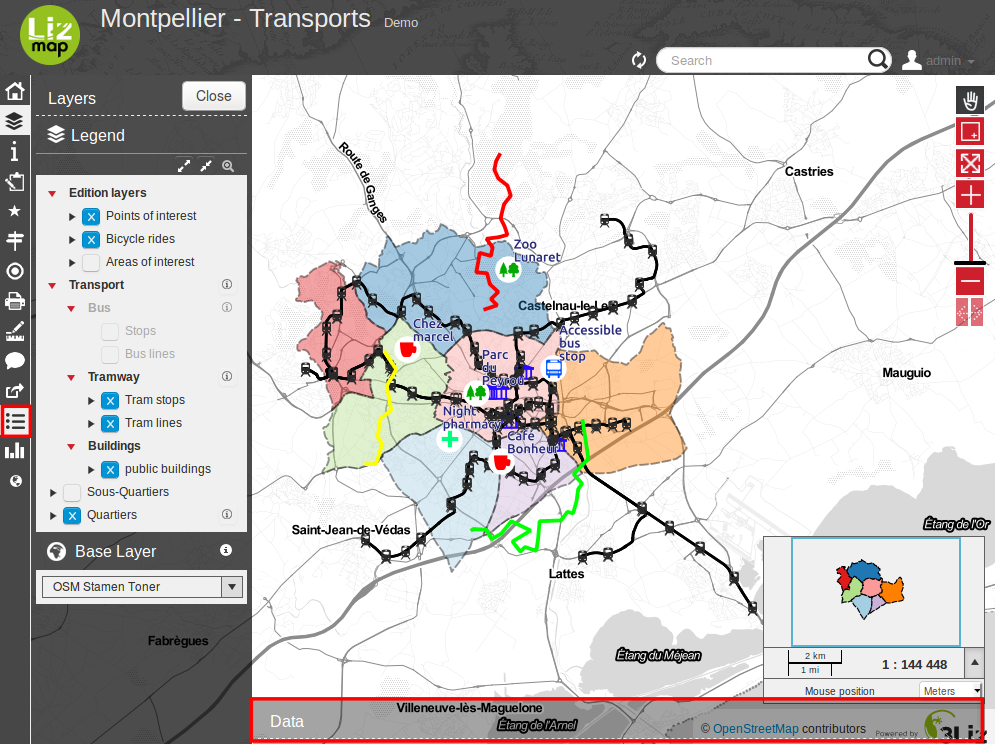
When this feature has been enabled by the map publisher for one or many vector layers, a new menu entry will be visible at the bottom of the menu bar, labelled as Data.
Clicking on this icon will open a new panel situated at the bottom of the interface, containing one single Data tab with a list of published vector layers.
Attribute table panel behaviour
Since this panel is situated above the map, some default behaviours have been proposed to ease the consultation of the data in the map and in the table at the same time.
The attribute table panel takes half the size of the screen
It is automatically reduced at the bottom when the mouse is out of it, and automatically displayed back when the user moves the mouse over the bottom of the map.
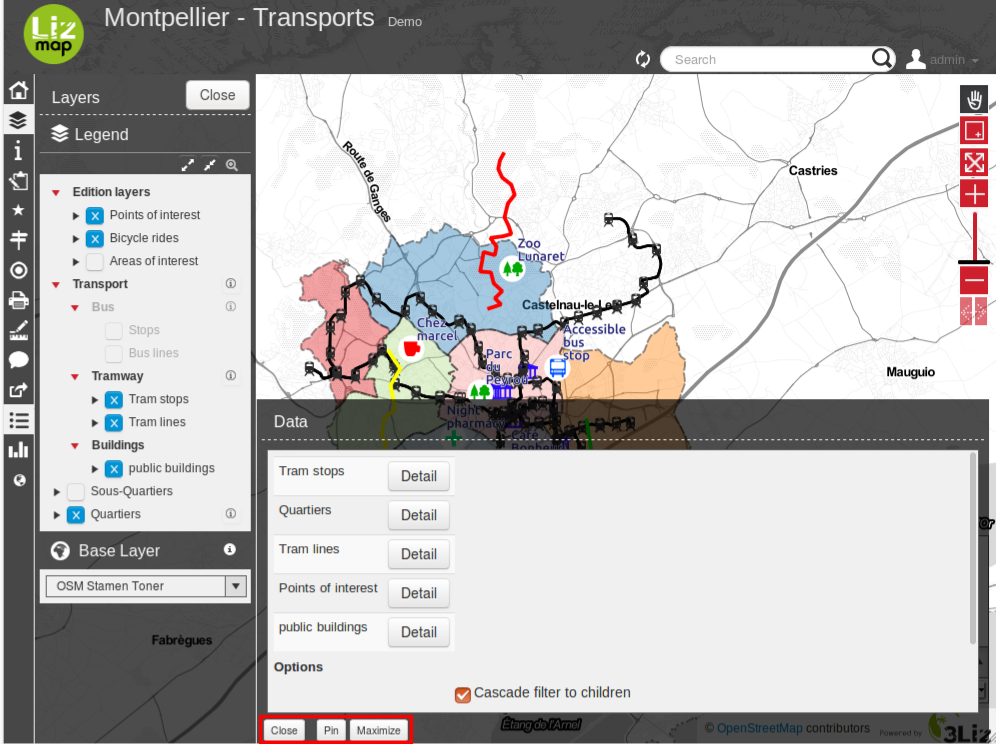
You can change the default behaviour by using the buttons displayed at the bottom of the attribute table panel
The Pin button deactivates the automatic reduction of the panel when the user mouse leaves it. But in this case, the whole panel will be displayed half transparent to allow the user to see the map underneath.
The Maximise button expands the panel so that it occupies the total place left between the left panel and the map header. This is handy when you need to have a confortable view of the layer data. In this configuration, the attribute table panel is also pinned, and won’t be reduced when the mouse leaves the panel, for example when hovering the left panel with the legend. But in this case, only the opacity of the attribute table panel will change so that you can see the map underneath.
You can click back on any of these 2 Pin and Maximise button to get back to the default behaviour.
The Close button closes the attribute table tool completely (as if you clicked in the menu bar icon).
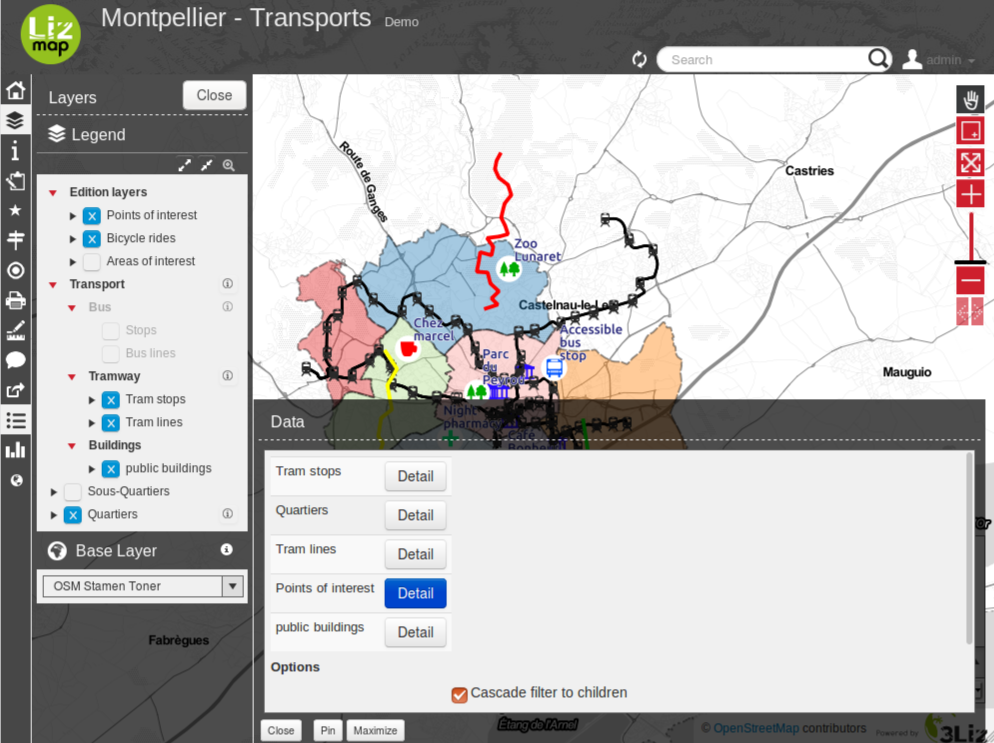
Open an attribute table for a layer
Once the attribute table panel is displayed, you can open the attribute table of each vector layer by clicking on the button situated right to the layer name. This will open a new tab labelled with the layer title which will show the attribute table for the chose layer.
Opening an attribute table can take some time depending on the data size and complexity.
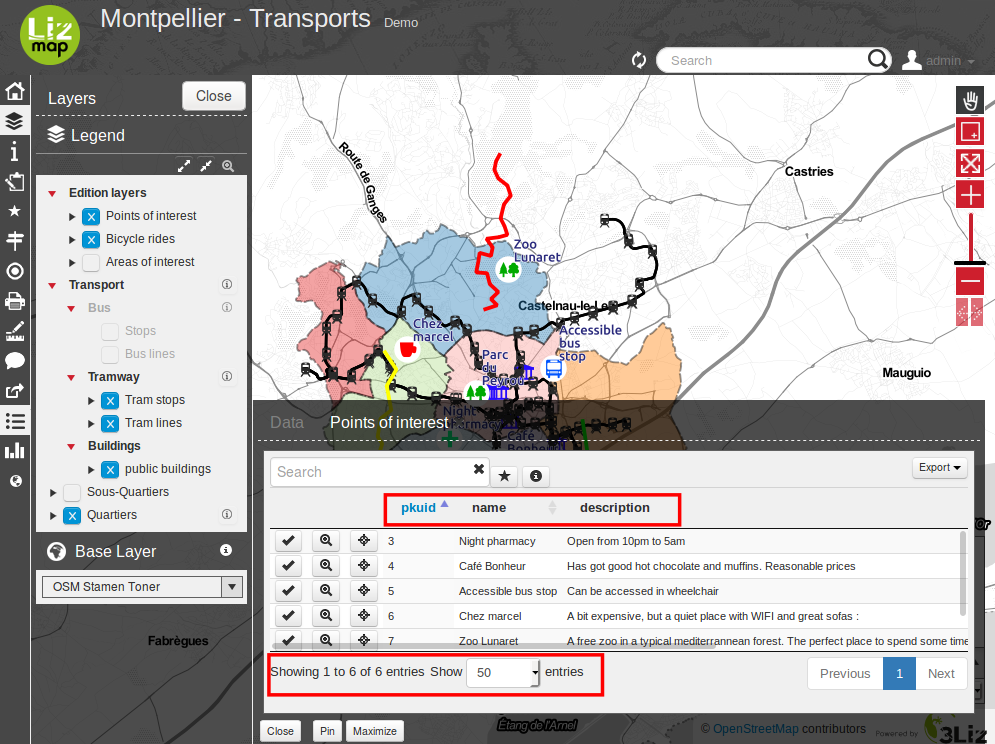
Description of the attribute table functionality
The layer data is shown in a paginated table. By default, the table shows 100 lines at a time. You can change this behaviour by using the list situated in the bottom left side of the tab content.
The table of data can be ordered by a field by clicking on the column corresponding to . If you click again on the column, the order will be reversed.
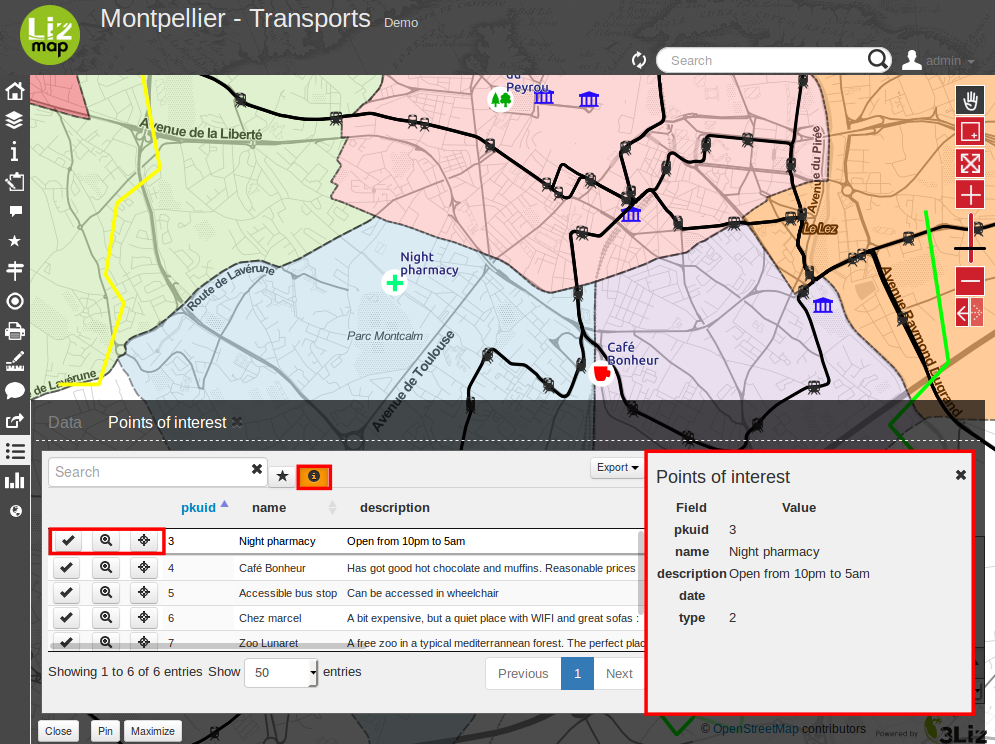
Actions on lines
When you click on a table line, the line will be displayed with a border to help viewing which line is highlighted.
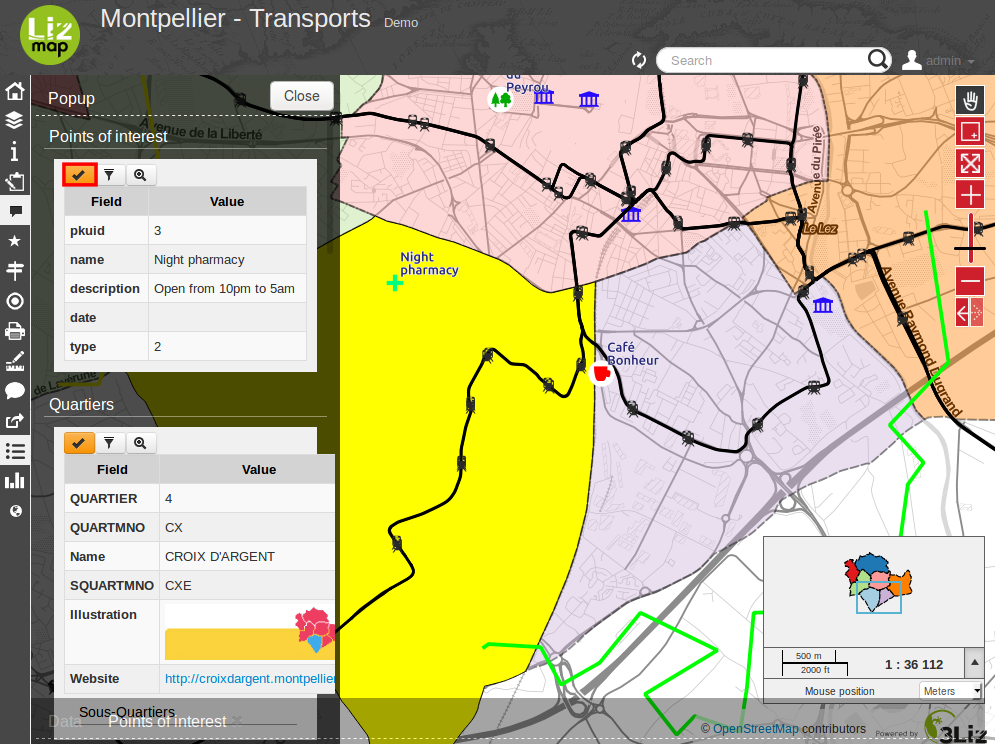
If the publisher has enabled the popup for the layer, you will be able to see the content of the popup for the highlighted feature by clicking on the (i) button (labelled with Display info when hovering the mouse on it). This will open a panel right to the table, which will display the detailed information on the highlighted table line. Furthermore:
Clicking on another line will refresh the right panel content with the new highlighted feature.
Clicking back on the (i) button or on the cross situated at the top right side of the information panel will hide the panel.
Each line of the table shows some buttons at the left side:
Select button : when clicked, the corresponding feature is selected. You can select many lines by using this button on different lines. The selected features will be displayed in a different style on the map, usually with a Yellow color. You can click again on the ”Select” to unselect a selected feature.
Zoom button : clicking on this button will zoom to the corresponding geometry in the map. The scale will be chosen so that the feature geometry uses most of the available space.
Center button : clicking on this button will just pan the map to the corresponding feature, without changing scale.
More about selection tools
You can also select a layer object by displaying the popup for this object (if the map publisher has enabled the popup for the layer, a click on the map will show a popup window containing detailed information on the clicked feature). Inside the popup, if you can see the select button, you can use it to select only this object. Previous selection will be replaced by only this object.
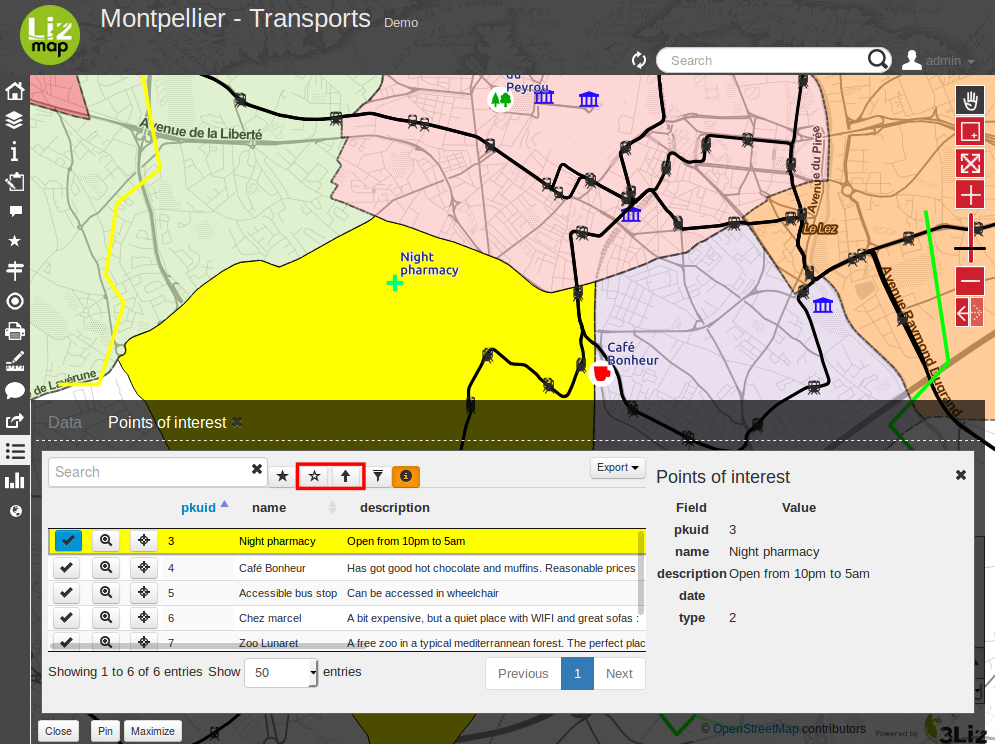
When one or more lines have been selected in the attribute table (they become yellow), you can use the black ”arrow up” button situated above the table to move the selected lines at the top of the table.
You can unselect all the selected objects by clicking on the ”white star” button situated above the table.
Quickly search through data
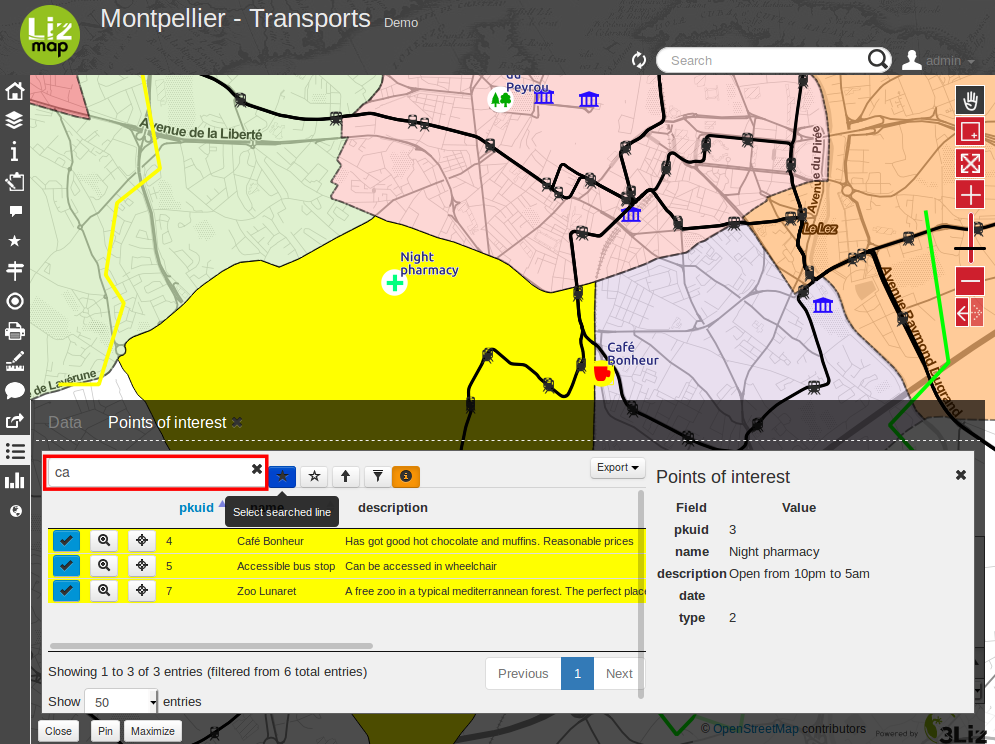
You can filter the lines displayed in the table by entering some letters in the Search field situated at the top left side of the tab content. If you want to see all the features again, just erase the search field content manually or by clicking on the cross button situated inside the field.
The text entered in the search field launches a search among the data for all the fields of the table.
Note that only the content of the table will be restricted to the lines matching your textual search. The objects on the map will not be filtered dynamically (but you could use select and filter to do so, see below)
Once you have filtered some data in the attribute table by entering some text in it, you can easily select them all by clicking on the ”black star” button labelled ”Select searched lines”. This will select all the corresponding objects in the attribute table (display them in yellow) and also change their color in the map (usually in yellow too, depending on the configuration done by the map publisher)
Filter data
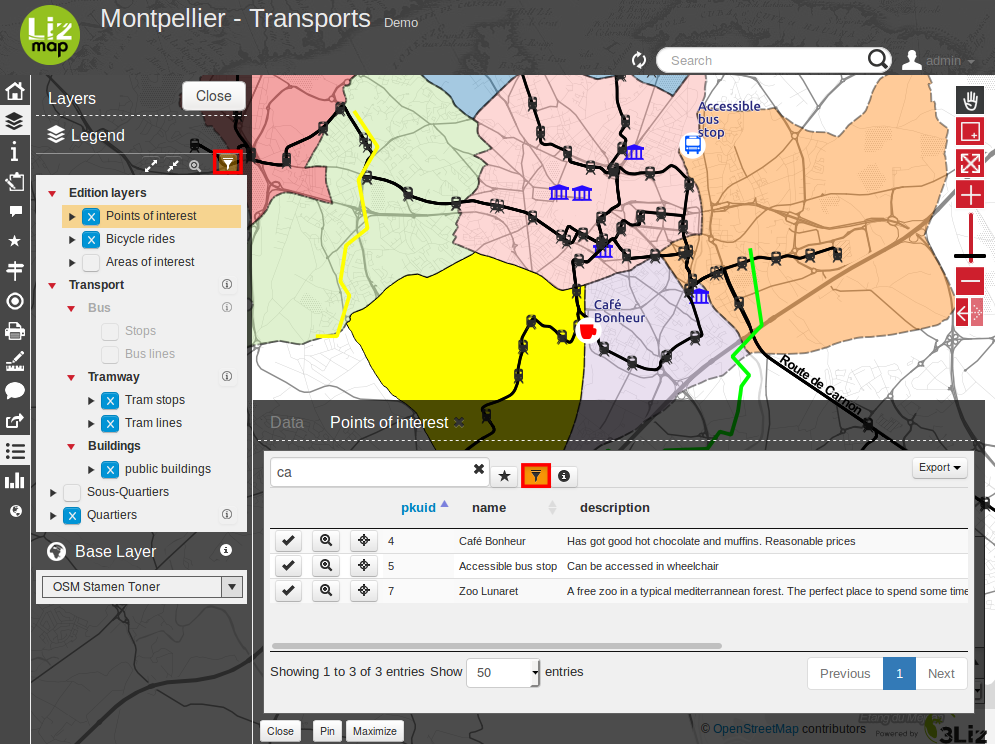
When you have selected one or more objects in the layer attribute table, you can then filter the data displayed in Lizmap for this layer. To do so, just click on the ”Funnel” button labelled ”Filter” situated above the table (only available if some the selection contains at least one object).
Filtering will have the following consequences:
The attribute table will show only the filtered data
The Search input field will allow to search only among filtered data
The map will show only the filtered objects
The child layers linked with relations (and also published in the attribute table tool) will be filtered too. We call it ”cascading filtering”. For example, the bus stops could be filtered automatically if you have filtered one bus line, to show only the ones served by the filtered line.
The filtered layers will be marked in the left panel legend with an orange background, and a new orange ”Funnel” button will be displayed above the legend.
You can cancel the filter to go back to previous state:
by clicking on the orange ”Funnel” button at the top of the legend in Lizmap left panel
by clicking back on the filter button just above the attribute table concerned by the filter
When exporting the map view with the permalink tool (situated in the menu bar), the filter will be activated in the linked map and the users won’t be able to easily unfilter the data : the unfilter button will not be displayed in Lizmap interface The only way would be to remove the filter parameters from the permalink URL. This is not a safe way to protect some data, but a way to focus on some data only.
More complex scenarios : relations between layers
todo